 Bookmark this on Delicious
 Recommend to StumbleUpon
This is the first of three web pages explaining the development of a small application which I wrote for turning data in files into graphs on the screen, and to give me a way to draw lines on the graph. The placement of the lines is "remembered" by the system from one session to the next.
Many general techniques are illustrated along the way. A compiled .exe is available so that you can play with the application without having to compile it. The Lazarus sourcecode is in the same zip file you can download. Both are there for you to play with... but I reserve all rights to any applications derived from the sourcecode. It is there to show you programming techniques, not to be the basis of a commercial product. Well... anyone else's commercial product, anyway.
I buy and sell shares in the stock market. It is NOT just about looking at past prices, consulting a crystal ball, and placing your "bets"... but the pattern in past prices is not "useless", either.
Furthermore, on any given date, I will have an opinion a variety of stocks. I may buy or sell that day, but more often I will, after updating my research feel that I want to "watch" something. See if it is behaving the way I think it is going to. If I think it is rising, and it is, I would make more money by buying right away. But that "if" is significant. By regularly giving up a little potential profit, I regularly save myself getting into something which is NOT doing what one day's investigation says it is. (And the converse applies to selling.)
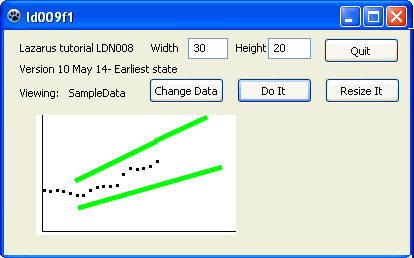
I have a way of sketching my thoughts. I hope that the following diagram gives you an idea of how I quantify my predictions...
That diagram isn't quite right... but should give you the idea until I can do a better one for you. The dots are the price for the stock...rising nicely, as you see! The green lines are by me, using my judgement. They define my guess as to the limits of what might happen in the future. The fundamental feature of the application that this tutorial discusses is to make managing those green lines, for multiple stocks, user friendly. The application will only present one such graph at a time, but it will be easy to switch between data sets. Each data set will have and remember its own green lines.
For years, I've dreamed of a computer program to help me with my investing, and I am finally getting close to producing one.... which is not what I am going to do in this tutorial. But I will go into some of the ingredients of my stock prices watching program, generally useful ingredients which you may have your own uses for.
Getting the computer to draw my diagrams will lead to several benefits... I won't be lost in a sea of bits of paper. I will be able to find the one I want. But more importantly, I can get the computer to routinely and rigorously check the progress of any stock about which I've drawn a diagram, and bring different classes of stock to my attention... those I haven't reviewed recently, those which are performing as I thought they would, those that aren't. With the diagrams I can see what's rising (or falling) rapidly, or not so rapidly, etc.
This tutorial is huge. Not at all typical of my tutorials. But it covers a lot of ground. It looks at a "grown up" application, not a little demo. The sourcecode will be available.
The programming is done. The tree pages of tutorial are "done"... but they need editorial work. The information in the tutorial is good. But the quality of the presentation and the English in the text still needs work. But it is already worth at least what you're going to pay for it.
Here's an outline of what is in the rest of this page... the first of three which between them tell the whole story.
First you'll be shown a simple way to make a set of data available to a program. In the final version of the application, the data on prices (many Date/ Price records) will come from an external data files. Initially, while building my way to display that data and put some "prediction" lines on the graph, I'm going to hardcode the data inside the program, so it is easily available, and we won't have to think about external data files... at first. Apart from anything else, this "data from hardcode" bit will be an example of a development technique: Don't try to do everything at once... but always keep in mind where you are going. I'm "shirking" data FILES for the moment, getting my data more easily. But I will be building the demo app in such a way that in due course the "easy" data source can be swapped out for "data- from- external- file".
Then we'll build a tiny app which merely gives us a "bit of paper" to draw the diagram on.
We'll take a moment to look at making that flexible, making it respond nicely to the user's wishes as to how big it is.
We'll take a deep breath, and push through two not-trivial bits: "Just" drawing a graph with the stock prices on it for different days, using "easy" data. Not hard, really, but it took me over a day to write it up... so not "easy", either.
Once we have that much working, we will make things fancier: We will provide scaling services so that different date ranges can be shown, the size of the graph can change, and the range displayed on the Y axis can change. that will be "fun".
Extending it from there to fully meet our wants is a little tedious. Especially if, as we will, we make the scaling flexible... but we will do it.
Once we've got that much working, applying the two green lines to show what we think the upper and lower limits of the stock's price will be in the weeks ahead is relatively simple. Not so simple is making it possible to draw AND RE-DRAW those lines... but we'll do that too, as the grand finale, which I have put in my separate web page about drawing and moving two lines on a graph..
Along the way, we will develop a way to store efficiently our idea of where the price limit lines should be.
There was once a language called BBC Basic. Some would criticize it today, and certainly it permitted the use of bad techniques. Other Basics remain to this day ("Beginners All-purpose Symbolic Instruction Code"). They may or may not have something BBC (and other early) Basic(s) had... the "Read" and "Data" statements.
They worked as illustrated by the following....
The program...
10 for c1=0 to 5
20   read x,y
30   print x '---' y
40 next //ends "For" loop
50 Data 1,11,2,200,5,123
52 Data 300,5,60,70
Would generate...
  1 ---  11
  2 --- 200
  5 --- 123
300 ---   5
 60 ---  70
Do you see? The "Data" lines were like hardcoded data files. The first call of a "Read" statement found the first data line, picked up what it needed **and remembered what it had already used.** Thus, when any further "Read" statement executed, you got the next datum, then the next, and so on and so on.
When I write my price watching program, I will of course be using external data files to hold the data. But for this demonstration program, that's extra complication we don't need.
The data for the demo will consist of pairs of numbers, both positive integers, The first will be quite large, and stand for the day the price was seen. The second number will stand for a price, in pennies. There will be many pairs of such numbers, in reverse chronological order. (That order is something I am specifying in the design. A datafile of prices could have other set ups, of course, but for my program, I will ensure that data files arranged as I have specified will be available.
Using a large number for the date isn't as daft as it seems. qexpand why not daft, perhaps.
I am starting this tutorial on May 7th, 2014. The number for that date, in "my" system is 41766. Tomorrow, May 8th, will be "day" 41767, and yesterday was 41765.
This numbering system isn't "mine" of course. It is the system used by Apache Open Office. (Put then numbers into an Open Office spreadsheet, and play with the formatting applied to the cell, to see this in action. Day "zero" was December 30,1899.) Delphi and Lazarus use a similar system, but I can't promise you they use the same start day, although I think maybe they do. (Very early Delphis used a different start day. The "useful" things you learn in a Sheepdog Guides tutorial!)
ANYWAY... for this demo program, I'm going to store my data in a very big string called sData. I will separate records with forward slashes, and the fields in a given record with hyphens.
So: If the price on May 7th 2014 of the stock we are interested in was $23.50, and on the 6th, it was $22.80, then sData would start....
41766-2350/41765-2280
I'll use a global variable (bad... but sometimes you break the rules... carefully) called wWhereInData which will point to the next unused character in sData.
And I create a procedure called ReadRecord which will return the next two numbers from sData.
999999 will be a rogue value. If ReadRecord finds that for the date, it will know not to read any further records. (The 999999 record should have a price datum to go with the "date" of 999999)
To get all that up and running, I've built....
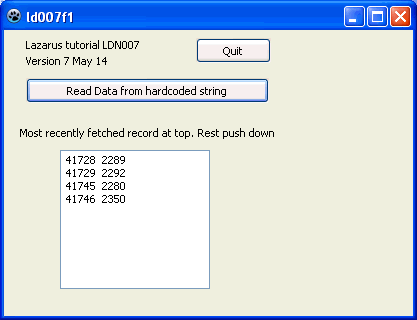
Run it. Click "Read Data from hardcoded string" repeatedly, and a new record should appear at the top of the list (pushing the older ones down) each time.
unit LD007u1;

{$mode objfpc}{$H+}

interface

uses
  Classes, SysUtils, FileUtil, Forms, Controls, Graphics, Dialogs, StdCtrls;

const vers='7 May 14';
      sData='41746-2350/41745-2280/'+
'41729-2292/41728-2289/41727-2279/9999-1000';

type

  { Tld007f1 }

  Tld007f1 = class(TForm)
    buReadData: TButton;
    buQuit: TButton;
    laAppInfo: TLabel;
    laFileMT: TLabel;
    laVer: TLabel;
    laDisplayOrder: TLabel;
    meOutput: TMemo;
    procedure buQuitClick(Sender: TObject);
    procedure buReadDataClick(Sender: TObject);
    procedure FormCreate(Sender: TObject);
  private
    { private declarations }
  public
    { public declarations }
    c1,wWhereInData,wDate,wPrice:word;
    sTmp, sTmp2:string;
    procedure ReadRecord(var w1,w2:word);
  end;

var
  ld007f1: Tld007f1;

implementation

{$R *.lfm}

{ Tld007f1 }

procedure Tld007f1.buQuitClick(Sender: TObject);
begin
  close;
end;

procedure Tld007f1.buReadDataClick(Sender: TObject);
begin
  //Using "insert:" so that newest data is at top of list
  ReadRecord(wDate,wPrice);
  meOutput.lines.insert(0,inttostr(wDate)+'  '+inttostr(wPrice));
end;

procedure Tld007f1.FormCreate(Sender: TObject);
begin
  wWhereInData:=1;//1 for next data to pick up starts at (string)[1];
  meOutput.clear;
  laVer.caption:='Version '+vers;
  lafileMT.caption:='';
end;

procedure Tld007f1.ReadRecord(var w1,w2:word);
//w1, w2 can have anything in them when the SR is called. Irrelevant.
//wWhereInData must have a correct value. Should be 1 when ReadRecord
//    first called
//Pick up two numbers from global constant sData.
//(Using globals, the way wWhereInData and sData are being used is
//    a Bad Idea... and I will probably be punished. We shall see.)
begin
  sTmp:='';
  while (sData[wWhereInData] <>'-') and
     (sTmp<>'9999') do begin
     sTmp:=sTmp+sData[wWhereInData];
     inc(wWhereInData);
     end;//"While..."
     inc(wWhereInData);
  w1:=strtoint(sTmp);

  if w1<>9999 then begin //Read w2
  sTmp:='';
  while sData[wWhereInData]<>'/' do begin
     sTmp:=sTmp+sData[wWhereInData];
     inc(wWhereInData);
     end;//"While..."
     inc(wWhereInData);
  w2:=strtoint(sTmp);

  end;//Read w2

  if w1=9999 then begin
       wWhereInData:=wWhereInData-5;
       laFileMT.caption:='All available data has been read.';
       buReadData.enabled:=false;
  end;

end;

end.
========================
=-=-=-=-= So! We have a mechanism for supplying a quantity of dates and prices to our graphing program.
Put that bit of knowledge to one side for the moment.
It isn't hard to set up a drawing surface on a Lazarus application's window. See....
https://sheepdogguides.com/lut/lt1Graphics.htm
... for the basics.
(Visit https://sheepdogguides.com/lut/PixelProblem.htm first, for a "Stop Press")
Once it is set up, assuming we've called it Bitmap, we can plot a point on the drawing surface at x=10, y=20 with...
Image1.Picture.Bitmap.canvas.pixels[10,20] := clGreen;//or another color
(An isolated dot can sometimes be hard to see. The standard Windows "Magnifier" tool (at Accessories/ Accessibility, from the XP start menu) will help you see small details.)
However, to do even just the basic graph of prices we talked about, we're going to have to get a whole lot more clever, to deal with the issues of "squeezing" our real world data (even the simulated "real world data" we will create for testing our code) into the coordinate system of the drawing area on our screen.
The first of several secrets is this: Develop your "answer" using simple numbers which you can get your head around. But your "answer" must be done in a way which can "digest" any numbers.
Another secret is to think of the coordinates-based drawing slightly differently than I suspect many people do. The "usual", I would guess, way of thinking of drawing with coordinates is to think in terms of infinitesimal points. In drawing on a computer screen, you are really talking about switching on or off pixels of very real widths and heights. On a modern screen, they may by tiny, but they are there.
For my early development work, to keep the numbers down to things I can deal with in my Tiny Little Mind, and draw (ink on paper.) For this, I am using a drawing area which is only 30 pixels wide and 20 high... and before you rush on, and say, "Okay, that's easy enough"... stop and think.
Lazarus (and Delphi... there's almost nothing in this that doesn't apply equally to both. The only difference in anything we're doing here is that in Lazarus, you have to take two tiny steps (shown earlier) when first setting up the drawing area to have a white background for what you are going to draw.)....
As I was saying, Lazarus provides a built-in way to draw a line.
If you put the following into your code...
Image1.Picture.Bitmap.canvas.pen.color:=clGreen; Image1.Picture.Bitmap.canvas.moveto(5,5); Image1.Picture.Bitmap.canvas.lineto(15,15);
...You will get a green line from 5,5 TO 15,15. (Pixel 5,5 will be green, and the line will END just BEFORE pixel 15,15. (The command is lineTO, after all.)
So... we are working with a 20 x 30 drawing area. What numbers do you think you use to draw from the upper left to the lower right corners. To. Not past. What are the EXACT numbers to JUST get both the corner pixels colored green (and all the others in between, too, of course)?
qspoiler gap
The right answer: 0,0 and 30,20. There is no "pixel 30,20"... but the lineTO command doesn't color the "to" pixel. The pixel at the bottom right is pixel 29,19, but if we did lineto(29,19), the last pixel, the lower right-hand pixel would not be colored. (You are allowed to "draw off the page"... even in negative directions.)
=== Flexibility
Now... I said we'd start with "human sized" numbers, and then "do things" so that we can take advantage of the computer's power. And we will. And we are going to start building in those "things" now.
The way we make our program flexible is by careful use of variables and constants.
If you know that you will never want to change some number, until you one day re-write the program, put it in a constant.
If you MAY want to give the user access to something, put it in a variable.
At this stage, in this project, I see nothing that I'd want in a constant.
We will put a few things in variables which we won't necessarily give users a way to change. But we will keep the possibility open. Those parameters will be "constants", in effect, for the user, until we add code. But set things up so that you COULD add code.
(The decision is rarely hard to reverse. You can usually convert a variable to a constant, or vice versa. But do think about the possibilities.)
We're going to go back to our growing application now, and simply build something which sets up the drawing area, and draws a line from upper left to lower right.... but is set up with flexibility built in.
First, we'll do it "badly", NOT flexibly. All the following will do is set up a drawing area, and, when you click the Do It button, put a diagonal line across it.
unit LD008u1;

{$mode objfpc}{$H+}

interface

uses
  Classes, SysUtils, FileUtil, Forms, Controls, Graphics, Dialogs, StdCtrls,
  ExtCtrls;

const vers='8 May 14- just draw diagonal stage-tweaked';

type

  { Tld008f1 }

  Tld008f1 = class(TForm)
    buQuit: TButton;
    buDoIt: TButton;
    Image1: TImage;
    laAppInfo: TLabel;
    laVer: TLabel;
    procedure buDoItClick(Sender: TObject);
    procedure buQuitClick(Sender: TObject);
    procedure FormCreate(Sender: TObject);
  private
    { private declarations }
    Bitmap:TBitmap;
    iImageLeft, iImageTop, iImageWidth, iImageHeight:integer;

  public
    { public declarations }
    end;

var
  ld008f1: Tld008f1;

implementation

{$R *.lfm}

{ Tld008f1 }

procedure Tld008f1.buQuitClick(Sender: TObject);
begin
  close;
end;

procedure Tld008f1.buDoItClick(Sender: TObject);
begin
  Image1.Picture.Bitmap.canvas.pen.color:=clGreen;
  Image1.Picture.Bitmap.canvas.moveto(0,0);
  Image1.Picture.Bitmap.canvas.lineto(30,20);
  end;

procedure Tld008f1.FormCreate(Sender: TObject);
begin
  laVer.caption:='Version '+vers;

  //Variables related to the TImage object...
  //See https://sheepdogguides.com/lut/lt1Graphics.htm for details
  //  of the basics of this part of the project, getting a useable
  //  drawing surface to work with...

  //This "two tier" system... value into iImageLeft, and then
  //  Image1.left filled from that... may seem odd. There are
  //  reasons we need it, trust me!

  iImageLeft:=32;
  iImageTop:=120;
  iImageWidth:=30;
  iImageHeight:=20;

  Image1.left:=iImageLeft;
  Image1.top:=iImageTop;
  Image1.width:=iImageWidth;
  Image1.height:=iImageHeight;

  Bitmap:=TBitmap.create;//Create a bitmap object
  Bitmap.width:=iImageWidth;//Assign dimensions
  Bitmap.height:=iImageHeight;

  //In Delphi, bitmap background is white to begin with. Black in Lazarus
  Bitmap.canvas.pen.color:=clWhite;//1 of 2 lines not needed in Delphi...
  Bitmap.canvas.Rectangle(0,0,iImageWidth,iImageHeight);//2 of 2 not needed, Delphi

  Image1.Picture.Graphic:=Bitmap; //Assign the bitmap to the image component

  //That brings us to the end of the things covered in the earlier tutorial,
  //    https://sheepdogguides.com/lut/lt1Graphics.htm


end;
end.
==code
Now add two input boxes to the application, one for drawing area width, one for drawing area height.
Use edit boxes. Put labels beside them. Yes... if you put something other than a number in the edit box, it would cause problems in a commercial application, but you are not going to release this, are you? You can remember: These edit boxes should only have numbers put in them.
And in a commercial application, you would fix things so that as soon as what was in the edit box changed, the user would see a result. For our demo program, we will put "take notice of what is in the edit boxes" into a "Resize It" button. (Put that button on the form now; we'll write its code in a moment. Name it buResizeIt, caption it "Resize It" to keep your "resize" distinct from the system's "resize".)
Hard-code the initial text property values for the width and height edit boxes 35 and 25... yes, slightly different from the width and height we have been using.
Now. It "should" be simple to Just Do It, and it would be... apart from just one line.
Create/ Destroy/ Create...
I may be making this more complicated that it NEEDS to be. Better than not complicated enough. There's nothing wrong with what we are doing (as far as I know), but it may not be necessary to go "back" quite so far if you want to change the size of the bitmap.
In our form's handler for its FormCreate event, we have the line...
Bitmap:=TBitmap.create;
The Create method sets aside some memory for the object's use, apart from other things. Whenever you do a Create, there must be a matching "Destroy".
At the moment, we are relying on the "Destroy" that takes place as part of the closing of the application to supply the "Destroy" we need. But if we want a different sized bitmap on Image1, we will have to proceed carefully.
As is always the case when we want to do something more than once somewhere in an application, it is best to put the code to be executed multiple times in a subroutine of its own.
We need to do TBitmap.create both when the application opens for the first time, and also after we have decided on a new size. And called the destroy method for the first bitmap before we create the new, different size one.
A few odds and end go with the TBitmap.create code. I've put them all in a procedure I've called EstablishBitmap. (A discussion of the following occurs after the sourcecode.)
Here is an early stage of LD008. (Note the designation thus in the "ver" constant. We will be expanding LD008 shortly.)
unit LD008u1;

{$mode objfpc}{$H+}

interface

uses
  Classes, SysUtils, FileUtil, Forms, Controls, Graphics, Dialogs, StdCtrls,
  ExtCtrls;

const vers='10 May 14- early stage- tweaked';

type

  { Tld008f1 }

  Tld008f1 = class(TForm)
    buQuit: TButton;
    buDoIt: TButton;
    buResizeIt: TButton;
    eWidth: TEdit;
    eHeight: TEdit;
    Image1: TImage;
    laAppInfo: TLabel;
    laTxtWidth: TLabel;
    laTxtHeight: TLabel;
    laVer: TLabel;
    procedure buDoItClick(Sender: TObject);
    procedure buQuitClick(Sender: TObject);
    procedure buResizeItClick(Sender: TObject);
    procedure FormCreate(Sender: TObject);
  private
    { private declarations }
    Bitmap:TBitmap;
    iImageLeft, iImageTop, iImageWidth, iImageHeight:integer;
    procedure EstablishBitmap;
  public
    { public declarations }
    end;

var
  ld008f1: Tld008f1;

implementation

{$R *.lfm}

{ Tld008f1 }

procedure Tld008f1.FormCreate(Sender: TObject);
begin
  laVer.caption:='Version '+vers;

  //Variables related to the TImage object...
  //See https://sheepdogguides.com/lut/lt1Graphics.htm for details
  //  of using a bitmap as a drawing surface to work with...

  iImageLeft:=32;//Set initial values for core variables
  iImageTop:=120;
  iImageWidth:=30;
  iImageHeight:=20;

  Image1.left:=iImageLeft;//Set initial size of TImage control
  Image1.top:=iImageTop;
  Image1.width:=iImageWidth;
  Image1.height:=iImageHeight;

  EstablishBitmap;

end;

procedure Tld008f1.buDoItClick(Sender: TObject);
begin
  Image1.Picture.Bitmap.canvas.pen.color:=clGreen;
  Image1.Picture.Bitmap.canvas.moveto(0,0);
  Image1.Picture.Bitmap.canvas.lineto(iImageWidth,iImageHeight);
  end;

procedure Tld008f1.buResizeItClick(Sender: TObject);
begin
  Bitmap.destroy;

  iImageWidth:=strtoint(eWidth.text);
  iImageHeight:=strtoint(eHeight.text);

  EstablishBitmap;

end;

procedure Tld008f1.EstablishBitmap;
//A purist would pass things like iImageWidth to this procedure
//   as parameters. I am "breaking the rule" deliberately,
//   judging the value, here, not worth the nuisance.
begin
  Image1.width:=iImageWidth;
  Image1.height:=iImageHeight;

  Bitmap:=TBitmap.create;//Create a bitmap object
  Bitmap.width:=iImageWidth;//Adjust dimensions
  Bitmap.height:=iImageHeight;

  //In Delphi, bitmap background is white to begin with. Black in Lazarus
  Bitmap.canvas.pen.color:=clWhite;//1 of 2 lines not needed in Delphi...
  Bitmap.canvas.Rectangle(0,0,iImageWidth,iImageHeight);//2 of 2 not needed, Delphi

  Image1.Picture.Graphic:=Bitmap; //Assign the bitmap to the image component
  //Note how we have adjusted the size of the image to the size of the bitmap
  //   we will be assigning to it.


end;

procedure Tld008f1.buQuitClick(Sender: TObject);
begin
  close;
end;

end.
The code above creates a little app which will put a "graph" on the application's window. If you change one or both of the values for "width" and "height", and click "Resize it", you get a new, blank bitmap displayed on the new, different size TImage control. Clicking DoIt at any time draws a line diagonally across the bitmap.
I trust that code is sufficiently readable?
In the handler for the FormCreate event, we set some global variables to initial values, and call EstablishBitmap.
EstablishBitmap creates a drawing surface on Image1. And it fills wGrGAWidth and wGrGAHeight with the Width and Height of the "Graph Area". (I will try to say more about this in due course. The "Graph Area" is that part of the bitmap to the left, and above, the two axes.
And that's about all that happens until we click DoIt or ResizeIt.
Clicking DoIt draws a diagonal line across whatever bitmap currently exists.
Clicking ResizeIt calls the Destroy method of the current bitmap, but then calls EstablishBitmap, to put a new one in place, after first consulting the "width" and "height" edit boxes.
So far, so good!
======
Let me remind you of two things I said earlier...
The first of several secrets is this: Develop your "answer" using simple numbers which you can get your head around. But your "answer" must be done in a way which can "digest" any numbers.
Another secret is to think of the coordinates-based drawing slightly differently than I suspect many people do. The "usual", I would guess, way of thinking of drawing with coordinates is to think in terms of infinitesimal points. In drawing on a computer screen, you are really talking about switching on or off pixels of very real widths and heights. On a modern screen, they may by tiny, but they are there.
We're now going to work for a bit on an image with nice "human size" numbers... the whole drawing area will be 30 x 20. (Horizontal number will be first throughout. Beware the vertical number, though. While it will always be second, sometimes it will tell you how far down from the top a point is... that's the usual way in computer graphics... and sometimes it will be how far up from the bottom something is, as in your earliest graph drawing. And sometimes where "zero" is won't be the edge of Image1... but we will overcome all these ways to go wrong.
Diag1 {{{ TO BE SUPPLIED STILL
I'm saying several things in the diagram above...
I'm going to have two axis lines. They will run to the top of the drawing area and to the right hand edge. They will be one pixel wide. A left margin (6 pixels wide, for now) and a bottom margin (4 pixels) will be created.
I will put 4 in wGrMarBott and 6 in wGrMarLeft and use those variable anywhere that I am using either margin dimension. If I succeed in always referring to those dimensions thus, it should be simple to draw the graph with different margins, should I choose to do so. The names may need comment:
w for "word" type data
Gr for "to do with the GRaph"
Mar for "MARgin"
Left/ Bott for "left" and "BOTTom".
While I will be surprised if I ever use more than a pixel for the width of the axis line, I will still set up two variables to make it (relatively) easy to have second thoughts. I will put 1 in bGrAxWidX and bGrAxWidY. ("b" for "byte", as I am comfortable in locking myself in to never having an axis line wider than 255 pixels(!). (Ha! The "decision" to skimp on implementation of drawing axis lines wider than one pixel cost me about three hours of head-scratching. But useful head scratching, I suppose... I was wiser by the end of resolving the puzzles which arose. All of the arising puzzling matters have been edited out of this, unless I missed something in the ensuing rewrite.)
Here's LDN008 revised to draw in the horizontal axis. Note that a separate "DrawGraph" procedure has been set up, to "contain" the drawing of the graph, and the "Do It" button has been re-purposed... it now simply calls DrawGraph.
Don't let the complex things like....
Image1.Picture.Bitmap.canvas.moveto
    (wGrMarLeft,      iImageHeight-wGrMarBott-1);

    Image1.Picture.Bitmap.canvas.lineto
    (iImageWidth,   iImageHeight-wGrMarBott);
... overwhelm you. We're going to "get rid" of them! But I wanted you to see how "messy" things are... INTERNALLY. And don't underestimate them. (We'll discuss in a moment.)
(The various dimension variables have all been given initial values in the FormCreate handler.)
WHY is it so messy? Because we ARE dealing with drawing on a surface with point 0,0 at the upper left, and with the biggest X and Y coordinates at the lower right. Most eople are used, in "everyday life" to things being "the other way up", and even once that's taken care of, the 0,0 of our graph is not at the lower right of our bigger drawing area.
For now, we are only going to try to plot the following X/Y pairs, by the way...
9,13
11,13
13,12
15,8
18,10
20,7
You can pretend that says "on day 9, the price was $13, on day 11, the price was still $13, on day 13, the price had fallen to $12", and so on. Don't worry... we'll be doing "proper" dates and prices by the end!
So... going back to the messy....
Image1.Picture.Bitmap.canvas.moveto
    (wGrMarLeft,      iImageHeight-wGrMarBott-1);

    Image1.Picture.Bitmap.canvas.lineto
    (iImageWidth,   iImageHeight-wGrMarBott-1);
... which "simply" draws the bottom, X, axis line.
That really does have to be EXACTLY right. An extra "-1", or a MISSING "-1" will come back to haunt you terribly... even though a big part of my reason for writing this was to lay the ghosts of my own confusion in these matters, I still, even while "paying attention", frequently made such "errors of one". They DO matter!
Look closely at...
Diag 2 {{ DIAGRAM TO BE SUPPLIED
You have to get the endpoints of the line (highlighted in red) in just the right places.
I've shown the coordinates, as used in moveto and lineto in green. Such numbers will be called the bitmap coordinates, to distinguish them.
I determined the bitmap coordinates for the left hand end of the axis lines by going back almost to "counting on my fingers". I drew the diagram. For the X bitmap coordinate, I knew that the first pixel of the margin was in column 0, then next was column 1, and the one AFTER the 6th margin pixel would therefor be pixel NUMBER 6.
I again "counted on my fingers" for the Y bitmap coordinate of the left hand end of the line. It had to be 15.
Now, from my dimension variables, where could I get 6 and 15? The six was easy: wGrMarLeft. Not wGrLeft plus 1 or minus 1... which you often need... but simply wGrMarLeft.
And the 15? Well, it was going to be something like the height of the whole drawing area minus the height of the bottom margin... iImageHeight-wGrMarBott. But with the size and margin we are using, that gives you 16... so, here, we need a "-1". It is all to do with whether you are starting from zero, and whether you want "THAT" one, or the one after it. (For the axis, we want the pixel AFTER the last pixel of the margin.)
It is a bit of a black art... just remember: You have to get EXACTLY the right number, and a +1 or a -1 may be needed, and you should draw a diagram and count on your fingers. Figure out what it needs to be for specific cases, and develop a variables-based formula which gives you the right numbers.
So.... having figured out where the X axis line goes, and assuming that a line a single pixel wide is adequate, doing the vertical axis line is easy, isn't it?
Image1.Picture.Bitmap.canvas.moveto
   (wGrMarLeft,  iImageHeight-wGrMarBott-1);

   Image1.Picture.Bitmap.canvas.lineto
   (wGrMarLeft,  -1);
(If you've noticed that the four lines to draw the axes can be replaced by just three... one moveto, two lineto's, then congratulations. If you haven't, it isn't a big deal.)
(While doing asides... you may be surprised to learn this, but I am not going to inscribe conventional scales on my graph, i.e. numbers along the axes to say what a given point represents. Those user wants aren't going to be totally ignored, but they will be dealt with unconventionally. I begrudge the screen space the numbers would require, and the effort it would be to do that programming. It can be done, by all means do it. but I won't (sorry) be providing THAT answer.)
Sigh.
It was genuinely only when I got to this point, and looked closely at the result that I discovered something.
(The Windows "magnifier" helped me to "look closely", by the way. In XP, it is in the "Accessories/ Accessibility" sub-menu.)
Image1 on my application's window, with its two axis lines (after I've clicked "DoIt") had a black line across the bottom and up the right hand side.
I wrote several paragraphs "explaining" this, its consequences and cures. And then realized that the black lines came from a different source than I expected. And so threw them away, and dealt with the issue differently. You, with the benefit of this tutorial, may never see those black lines.
Onwards!!!
We have some complex "stuff" where things should be simple. Look again at the code to draw the horizontal axis line...
    Image1.Picture.Bitmap.canvas.moveto
      (wGrMarLeft,      iImageHeight-wGrMarBott-1);

    Image1.Picture.Bitmap.canvas.lineto
      (iImageWidth,   iImageHeight-wGrMarBott-1);
Surely that should be...
    Image1.Picture.Bitmap.canvas.moveto
      (-1,-1);

    Image1.Picture.Bitmap.canvas.lineto
      (22,-1)
When we start trying to plot the points on our graph to show the prices of the stock on different dates, we don't want to be fooling around with allowing for margins, flipping the y coordinate from "big at bottom" to "big at top"... SO THIS IS WHAT WE DO....
We make two functions: iBitMapFrmHumX and iBitMapFrmHumY.
(In the course of developing this project, this wheel was invented twice. The name iBitMapFrmHumX was discarded in favor of iGAtoBitmapX, which was used for everything previously done with iBitMapFrmHumX after a certain stage in the program's development. Plans were in place to similarly slim down the corresponding functions for Y coordinates, but with humans and bitmaps numbering the Y axis in opposite directions, perhaps both functions will remain necessary to handle subtle differences?
We'll start them in "shell" form... they won't, at first actually do anything to the numbers passed to them. Eventually, they will return the "BitMap" number if given the "Human" number. What do I mean by "BitMap" and "Human" numbers? Go back to the case of drawing the horizontal axis. We draw it TO....
iImageWidth, iImageHeight-wGrMarBott-1
i.e., with things as we are doing them, TO (but not including... which is just as well, as it is off the right hand edge of the drawing area... 30,15. (Last pixel is at 29 across.) But, in terms of where that is on the part of the bitmap we are using for displaying data points, that would be
22, -1 {{ TO BE CHECKED. MAY HAVE Error-of-one
So, eventually, iBitMapFrmHumX will convert 22 to 29, and iBitMapFrmHumY will convert -1 to 15. {{CHECK THESE NUMBERS
Here's the core of the code at start of the process....
procedure Tld008f1.DrawGraph;
begin
  Image1.Picture.Bitmap.canvas.pen.color:=clBlack;

  Image1.Picture.Bitmap.canvas.moveto
    (iBitMapFrmHumX(wGrMarLeft),iBitMapFrmHumY(iImageHeight-wGrMarBott-1));

  Image1.Picture.Bitmap.canvas.lineto
    (iBitMapFrmHumX(iImageWidth-1),iBitMapFrmHumY(iImageHeight-wGrMarBott-1));

  Image1.Picture.Bitmap.canvas.moveto
    (iBitMapFrmHumX(wGrMarLeft),iBitMapFrmHumY(iImageHeight-wGrMarBott-1));

  Image1.Picture.Bitmap.canvas.lineto
    (iBitMapFrmHumX(wGrMarLeft),iBitMapFrmHumY(0));

  end;

function Tld008f1.iBitMapFrmHumX(iConvert:integer):integer;
begin
  result:=iConvert;
end;

function Tld008f1.iBitMapFrmHumY(iConvert:integer):integer;
begin
  result:=iConvert;
end;
"This is PROGRESS?", I hear you wail? Yes! It is! Really!
Well... it will be when we put "the guts" into the two functions.
When we've done that, if we want, say, to draw a line from the pixel one to the left of the area for our graph, the area INSIDE the axes, and one below the bottom of the area for our graph, we will start that line with...
Image1.Picture.Bitmap.canvas.moveto(
  iBitMapFrmHumX(-1),iBitMapFrmHumY(-1));
That IS better than what we need at the moment, isn't it?!
There's just the little matter of writing "the guts". And let me warn you up front: They are similar, but NOT the same.
Always start such work by figuring out how to deal with the end points. Get the formula for them right, and the everything else will just fall into place.
So... with our present image size and margins, and an axis line that is one pixel wide, we need....
X:      vvv NUMBERS NEED CHECKING FOR off-by-one ERRORS
   -1 in human terms should convert to 6 for the bitmap coordinates.. this from the left hand
end of the horizontal axis
   22 in human terms should convert to 29.. this from the right hand end of the horizontal axis.

Y:
   -1 in human terms should convert to 15 for the bitmap coordinates.. this from the bottom end
of the vertical axis
   14 in human terms should convert to 0.. this from the top end of the vertical axis
To consolidate that:
X:  -1 ->  6  {{{ CHECK NUMBERS
    22 -> 29

Y:  -1 -> 15
    14 ->  0
Notice, among other things that with X as one number goes up, so does the other one. But for Y, as the human number goes up, the bitmap number goes DOWN.
When you've worked out those values, and if you keep the "ingredients" (margin, overall size, axis width) in mind, you will probably be able to come up with the following. More importantly, those numbers will give you the means to test your guesses... I mean "deductions"!... as to what the formulae ought to be.
function Tld008f1.iBitMapFrmHumX(iConvert:integer):integer;
//ver 13 May 14, 16:18
begin
  iConvert:=iConvert+wGrMarLeft+bGrAxWidY;
  result:=iConvert;
end;

function Tld008f1.iBitMapFrmHumY(iConvert:integer):integer;
//ver 13 May 14, 16:18
begin
  //With iImageHeight=20, wGrMarBott=4, bGrAxWidY=1, the number that
  //  iConvert is taken away from should be 14.
  //The brackets aren't necessary for the mathematics, but are there
  //  to help you see the basic "trick" of inverting a series of
  //  numbers: take a varying but increasing "input" number away
  //  from a constant to obtain a varying but DEcreasing "output".
  iConvert:=wGrGAHeight-iConvert;
  result:=iConvert;
end;
Now that we have those two functions (and yes, they could be combined into a single procedure, using "var" type parameters to return the new coordinates)... Now that we have them, we can write the following to draw the two axes....
procedure Tld008f1.DrawXAxis;
var bTmpL:byte;
begin
  for bTmpL:=0 to bGrAxWidX-1 do begin
  Image1.Picture.Bitmap.canvas.moveto
    (iBitMapFrmHumX(-1),           iBitMapFrmHumY(-1-bTmpL));

  Image1.Picture.Bitmap.canvas.lineto
    (iImageWidth,iBitMapFrmHumY(-1-bTmpL));
  end;//for
end;

procedure Tld008f1.DrawYAxis;
var bTmpL:byte;
begin
  for bTmpL:=0 to bGrAxWidY-1 do begin
  Image1.Picture.Bitmap.canvas.moveto
    (iBitMapFrmHumX(-1-bTmpL),iBitMapFrmHumY(-1)+bGrAxWidX-1);

  Image1.Picture.Bitmap.canvas.lineto
    (iBitMapFrmHumX(-1-bTmpL),-1);
  end;//for
end;
That IS simpler than what we had before... really. And now, when working with moveto's and lineto's, the programmer can think in terms of the coordinates of the graphing area, "human" side up (Y increasing UP the page)
There IS a fair bit of text in the most recent code snippet, but it is very "regular". Once you analyze the pattern, there's not really a lot of complexity there. The "details" have been swept away into inside the iBitMapFrmHumX and -Y functions.
=======
I write these tutorials for you as I develop new applications. When I first wrote this paragraph, the above was WORKING... for iImageWidth=30, iImageHeight=20, wGrMarLeft=6, etc.... but I hadn't tried to USE the code's flexibility yet.
At the time, I would have said. "If all is well, the Resize button should still work just fine. (That will change the values in iImageWidth and Height)."
Whew! It did! Work.
"Should" have done... but we know how much that counts for in programming. What you said always trumps what you meant it to say.
Before going on, I checked one or two other things, even though they can't be changed as easily as the overall height and width of Image1. But, because the code is written for it, it isn't too hard to try different margin sizes.
Hurrah! Easy tests passed. It doesn't mean that the code can cope with "anything"... but at least it copes with some of the things I've thought of.
Notice: Because of the way the program is written, I can change my margins and my image size without making ANY changes to lineto and moveto statements.
The one thing I couldn't EASILY do with the existing code at the time I wrote the paragraphs above was to make thicker axis lines. I could tell the program that the axis line WILL be thicker, say 3 pixels, just by changing the values in bGrAxWidX and bGrAxWidY.
Ha! I was in a relaxed frame of mind just after doing the tests, when I wrote the first version of the previous paragraphs. I thought all was well, that I could get on to the next phase. I also wrote "But I won't see thicker axis lines. It would be easy to provide for thicker axis lines, though."
Well, and it was just as well, I thought I'd TRY changing the values in bGrAxWidX and bGrAxWidY. I thought I could anticipate what I would see. I didn't see what I anticipated. And for several hours I misinterpreted what I was seeing. Eventually, I wrote the code which allows axis lines of any thickness. (It was quite easy, but not without the odd little "gotcha" getting me, at first.
Why to I moan? To warn you against complacency. To encourage you to make tests whenever you see one that can be made. To explain why the code, quite a way up the page, HAS the "extra bits" which allow drawing wide axis lines.
We have a bitmap. On that bitmap, we have two axis lines. To the left of, and above the lines is a sub-section of the bitmap which I am going to call the "Graph Area" because that is where we will be doing our graph, and the lines predicting the movement of the stock price.
Two further variables will be useful. They hold the width and height of the Graph Area (in pixels). The variables' names are...
wGrGAWidth, and
wGrGAHeight
Note: If wGrGAWidth is, say, 20, that means that the "name" of the right hand pixel, when you base the "name" on calling the first pixel to the right of the axis "0" is "19". But, because lineTO draws TO, but not including a destination, to draw all the way to the right hand edge of the graph area requires a lineto(iBitMapFrmHumX(20),y); command. Yes... it is a little hard to stay on top of it all. But I don't think it can be made any "simpler".
In the ting we just did, we cheated slightly. We "drew" past the edge of "the paper". That will work if our line needs to go to the edge, and is nearly vertical or nearly horizontal. In other cases, we'll need a fancier answer, which we will put in a subroutine we will call MoveLineToAndInclude. It will have four parameters... the start and end points, in "human" terms, with 0,0 being the lower left-hand corner of the Graph Area.
Once we have that, MoveLineToAndInclude(0,0,wGrGAWidth-1,wGrGAHeight-1) will draw a line, in whatever color the "pen" happens to be set to, from the lower left hand corner of the graph area to the upper right-hand corner of the graph area, which is also the upper right-hand corner of the bitmap. When you test it, you won't be alarmed if it draws 11, not 10, pixels, will you? If you draw one at 0,0 and one at 10,10, and one at all the pixels in between, you ARE going to draw 11, aren't you? It is this sort of "error-of-one", or "fencepost" error that can drive you potty.
Believe it or not... the fates relenting?... I was able to generate and test....
procedure Tld008f1.MoveLineToAndInclude(iX1,iY1,iX2,iY2:integer);
begin
  Image1.Picture.Bitmap.canvas.moveto(iBitMapFrmHumX(iX1),iBitMapFrmHumY(iY1));
  Image1.Picture.Bitmap.canvas.lineto(iBitMapFrmHumX(iX2),iBitMapFrmHumY(iY2));

Image1.Picture.Bitmap.canvas.pixels[iBitMapFrmHumX(iX2),iBitMapFrmHumY(iY2)]:=Image1.Pic
ture.Bitmap.canvas.pen.color;
end; //MoveLineToAndInclude
... in under 15 minutes. There must be a bug in it which I won't spot until it is much harder to deal with. Sigh.
About an hour ago, we were talking of putting some datapoints on the graph. We'll do it very crudely, at first. The following go in the DrawGraph subroutine..
Image1.Picture.Bitmap.canvas.pixels[iBitMapFrmHumX(9),iBitMapFrmHumY(13)]:=Image1.Pictu
re.Bitmap.canvas.pen.color;

Image1.Picture.Bitmap.canvas.pixels[iBitMapFrmHumX(11),iBitMapFrmHumY(13)]:=Image1.Pict
ure.Bitmap.canvas.pen.color;

Image1.Picture.Bitmap.canvas.pixels[iBitMapFrmHumX(13),iBitMapFrmHumY(12)]:=Image1.Pict
ure.Bitmap.canvas.pen.color;

Image1.Picture.Bitmap.canvas.pixels[iBitMapFrmHumX(15),iBitMapFrmHumY(8)]:=Image1.Pictu
re.Bitmap.canvas.pen.color;

Image1.Picture.Bitmap.canvas.pixels[iBitMapFrmHumX(18),iBitMapFrmHumY(10)]:=Image1.Pict
ure.Bitmap.canvas.pen.color;

Image1.Picture.Bitmap.canvas.pixels[iBitMapFrmHumX(20),iBitMapFrmHumY(7)]:=Image1.Pictu
re.Bitmap.canvas.pen.color;
Crude! But it WORKS! Hurrah! A graph with some "stock prices" on it.
The program so far... apologies for "scraps" this may contain. I wouldn't suggest compiling THIS, but here it is, for what it is worth....
unit LD008u1;

{$mode objfpc}{$H+}

interface

uses
  Classes, SysUtils, FileUtil, Forms, Controls, Graphics, Dialogs, StdCtrls,
  ExtCtrls;

const vers='9 May 14- middle stage- plots unscaled simple data';

type

  { Tld008f1 }

  Tld008f1 = class(TForm)
    buQuit: TButton;
    buDoIt: TButton;
    buResizeIt: TButton;
    eWidth: TEdit;
    eHeight: TEdit;
    Image1: TImage;
    laAppInfo: TLabel;
    laTxtWidth: TLabel;
    laTxtHeight: TLabel;
    laVer: TLabel;
    procedure buDoItClick(Sender: TObject);
    procedure buQuitClick(Sender: TObject);
    procedure buResizeItClick(Sender: TObject);
    procedure FormCreate(Sender: TObject);
  private
    { private declarations }
    Bitmap:TBitmap;
    iImageLeft, iImageTop, iImageWidth, iImageHeight:integer;
    bGrAxWidX,bGrAxWidY:byte;
    wGrMarBott,wGrMarLeft,wGrGAWidth,wGrGAHeight:word;
    procedure EstablishBitmap;
    procedure DrawGraph;
    function iBitMapFrmHumX(iConvert:integer):integer;
    function iBitMapFrmHumY(iConvert:integer):integer;
    procedure DrawXAxis;
    procedure DrawYAxis;
    procedure MoveLineToAndInclude(iX1,iY1,iX2,iY2:integer);
  public
    { public declarations }
    end;

var
  ld008f1: Tld008f1;

implementation

{$R *.lfm}
{$R+}//Enable range checking

{ Tld008f1 }

procedure Tld008f1.FormCreate(Sender: TObject);
begin
  laVer.caption:='Version '+vers;

  //Variables related to the TImage object...
  //See https://sheepdogguides.com/lut/lt1Graphics.htm for details
  //  of using a bitmap as a drawing surface to work with...

  iImageLeft:=32;//Set initial values for core variables
  iImageTop:=120;
  iImageWidth:=57;
  iImageHeight:=37;

  bGrAxWidX:=1;
  bGrAxWidY:=1;
  wGrMarBott:=4;
  wGrMarLeft:=6;

  EstablishBitmap;//Must happen AFTER core variables have values


end;

procedure Tld008f1.buResizeItClick(Sender: TObject);
begin
  Bitmap.destroy;

  iImageWidth:=strtoint(eWidth.text);
  iImageHeight:=strtoint(eHeight.text);

  EstablishBitmap;

end;

procedure Tld008f1.EstablishBitmap;
//A purist would pass things like iImageWidth to this procedure
//   as parameters. I am "breaking the rule" deliberately,
//   judging the value, here, not worth the nuisance.
//Besides Establishing the bitmap, this routine changes the
//   values in some variables referred to elsewhere when
//   scaling things to fit graph well.
begin

  Image1.left:=iImageLeft;//Set size and posn of TImage control
  Image1.top:=iImageTop;
  Image1.width:=iImageWidth;
  Image1.height:=iImageHeight;

  Bitmap:=TBitmap.create;//Create a bitmap object

  Bitmap.width:=iImageWidth;//Adjust dimensions
  Bitmap.height:=iImageHeight;

  //In Delphi, bitmap background is white to begin with. Black in Lazarus
  Bitmap.canvas.pen.color:=clWhite;//1 of 2 lines not needed in Delphi...
  Bitmap.canvas.Rectangle(0,0,iImageWidth,iImageHeight);//2 of 2 not needed, Delphi

  Image1.Picture.Graphic:=Bitmap; //Assign the bitmap to the image component
  //Note how we have adjusted the size of the image to the size of the bitmap
  //   we will be assigning to it.

  //Now fill two variables with values for the width and height of the
  //  "Graph Area", i.e. that part of the bitmap to the left of, and
  //  above the two axes.
  //If there are 15 rows of pixels and and 25 columns of pixels in the
  //  Graph Area, then you would set wGrGAWidth:=15, wGrGAHeight:=25

  wGrGAWidth:=iImageWidth-wGrMarLeft-bGrAxWidY;
  wGrGAHeight:=iImageHeight-wGrMarBott-bGrAxWidX;
end; // of EstablishBitmap

procedure Tld008f1.DrawGraph;
begin
  Image1.Picture.Bitmap.canvas.pen.color:=clBlack;

  DrawXAxis;
  DrawYAxis;

  //MoveLineToAndInclude(0,0,wGrGAWidth-1,wGrGAHeight-1);

Image1.Picture.Bitmap.canvas.pixels
    [iBitMapFrmHumX(9),iBitMapFrmHumY(13)]:=
         Image1.Picture.Bitmap.canvas.pen.color;

Image1.Picture.Bitmap.canvas.pixels
    [iBitMapFrmHumX(11),iBitMapFrmHumY(13)]:=
         Image1.Picture.Bitmap.canvas.pen.color;

Image1.Picture.Bitmap.canvas.pixels
    [iBitMapFrmHumX(13),iBitMapFrmHumY(12)]:=
         Image1.Picture.Bitmap.canvas.pen.color;

Image1.Picture.Bitmap.canvas.pixels
    [iBitMapFrmHumX(15),iBitMapFrmHumY(8)]:=
         Image1.Picture.Bitmap.canvas.pen.color;

Image1.Picture.Bitmap.canvas.pixels
    [iBitMapFrmHumX(18),iBitMapFrmHumY(10)]:=
         Image1.Picture.Bitmap.canvas.pen.color;

Image1.Picture.Bitmap.canvas.pixels
    [iBitMapFrmHumX(20),iBitMapFrmHumY(7)]:=
         Image1.Picture.Bitmap.canvas.pen.color;

  end;

function Tld008f1.iBitMapFrmHumX(iConvert:integer):integer;
//ver 13 May 14, 16:18... see LT3Nf.htm, if you need to alter.
begin
  iConvert:=iConvert+wGrMarLeft+bGrAxWidY;
  result:=iConvert;
end;

function Tld008f1.iBitMapFrmHumY(iConvert:integer):integer;
//ver 13 May 14, 16:18... see LT3Nf.htm, if you need to alter.
begin
  //With iImageHeight=20, wGrMarBott=4, bGrAxWidY=1, the number that
  //  iConvert is taken away from should be 14.
  //The brackets aren't necessary for the mathematics, but are there
  //  to help you see the basic "trick" of inverting a series of
  //  numbers: take a varying but increasing "input" number away
  //  from a constant to obtain a varying but DEcreasing "output".
  iConvert:=wGrGAHeight-iConvert;
  result:=iConvert;
end;

procedure Tld008f1.DrawXAxis;
var bTmpL:byte;
begin
  for bTmpL:=0 to bGrAxWidX-1 do begin
  Image1.Picture.Bitmap.canvas.moveto
    (iBitMapFrmHumX(-1),   iBitMapFrmHumY(-1-bTmpL));

  Image1.Picture.Bitmap.canvas.lineto
    (iImageWidth,          iBitMapFrmHumY(-1-bTmpL));
  end;//for
end; //DrawXAxis

procedure Tld008f1.DrawYAxis;
var bTmpL:byte;
begin
  for bTmpL:=0 to bGrAxWidY-1 do begin
  Image1.Picture.Bitmap.canvas.moveto
    (iBitMapFrmHumX(-1-bTmpL),iBitMapFrmHumY(-1)+bGrAxWidX-1);

  Image1.Picture.Bitmap.canvas.lineto
    (iBitMapFrmHumX(-1-bTmpL),-1);
  end; //for
end; //DrawYAxis

procedure Tld008f1.MoveLineToAndInclude(iX1,iY1,iX2,iY2:integer);
begin
  Image1.Picture.Bitmap.canvas.moveto(iBitMapFrmHumX(iX1),iBitMapFrmHumY(iY1));
  Image1.Picture.Bitmap.canvas.lineto(iBitMapFrmHumX(iX2),iBitMapFrmHumY(iY2));
  Image1.Picture.Bitmap.canvas.pixels[iBitMapFrmHumX(iX2),
                    iBitMapFrmHumY(iY2)]:=Image1.Picture.Bitmap.canvas.pen.color;
end; //MoveLineToAndInclude

procedure Tld008f1.buQuitClick(Sender: TObject);
begin
  close;
end;

procedure Tld008f1.buDoItClick(Sender: TObject);
begin
  DrawGraph;
  end;

end.
We've built an application which can be displayed in different sized windows. And the area devoted to the graph can be changed. But, so far, the scales (X and Y) are fixed. This means that a larger graph just shows more blank space, and it means that the data range the application can display is restricted.
We're going to make some changes to the program, to dispense with those limitations.
In due course, the program will scan the data which is to be plotted. First, a range of dates to have their data displayed will be determined. Then, the prices for that range of dates will be analyzed, and the high and low price will be known. From those data, scaling constants will be derived, to be applied to the data so that it uses a suitable portion of the Graph Area. (That part of the bitmap to the right of, and above, the axis lines.)
We will ensure that the program is always presented with data, from whatever source, in reverse chronological order. If we can assume that, aspects of the programming are simplified, and execution times are improved. Think about it: If the user has said that he/ she only wants the graph to look back from today for 6 weeks, if you know the data is in chronological order, you scan the data until you encounter a date from more than 6 weeks ago. When you encounter that, you can dispense with the rest of the data file.
Initially, we're going to hardcode the data limits. We'll create the following variables for keeping track:
PrHigh
PrLow
We will, for the moment anyway, continue using the same data, i.e.
 9,13
11,13
13,12
15,8
18,10
20,7
You can pretend that says "on day 9, the price was $13, on day 11, the price was still $13, on day 13, the price had fallen to $12", and so on. Don't worry... we'll be doing "proper" dates and prices by the end!
Dates are expressed as days since an arbitrary start date. For our development work, we will initially say that "today" is day 20, and we only want to go back to day 9.
For our development work, the highest price in our data (above) 13 and the lowest is 8
So... to use all of the Graph Area, we should be scaling things so that on the X axis, we plot "9" at the left hand end, and "20" at the right hand end.
Now... the number of pixels available to us for this changes from time to time. Every time, in fact, that we resize the bitmap that the Graph Area is part of.
However: although we don't know "the number" for the current width of the Graph Area, we do know that whatever it is, it will have been stored in wGrGAWidth, and is thus available to us.
We'll put the date we want to be shown at the left hand end of the graph in DateBackTo, and the most recent date we want shown in DateFrom. Both are inclusive. In other words, in the specific case of our test data we want day 9's column at the left and day 20's at the right... and both ON the graph. (In due course, we may wish to arrange for some blank space to the right of the last data point, but that's something we can introduce later. I'm not just saying that wishfully. I've worked out that we can.
So... not unlike the challenge that faced us before when we were converting from bitmap pixel coordinates to human and graph friendly coordinates, we have what is a scaling problem.
For the X axis, in our specific case, we want some numbers which go from 9 to 20 (inclusive) to be evenly spread across the range 0 to whatever's in wGrGAWidth-1, inclusive. (And yes, the "-1" is important, and right.
Wouldn't it be nice if wGrGAWidth-1 were always 11? Then the rule would be simple: Date m should be shown on the graph at m-9. What if wGrGAWidth-1 were always 22? Then the rule would be (m-9) times 2, wouldn't it?
All such scaling problems come down to the same formula: The number you need is your previous number minus some constant (k1), and then that is multipled by some other constant (k2).
If your high and low numbers (for the data, 9 and 20, in our case) are in the variables DateFrom and DateBackTo, as we said they would be, then k1 is simply DateBackTo.
The other constant, k2, is a little less obvious. It can be obtained from....
((wGrGAWidth-1)-(0))/(DateFrom-DateBackTo)
In terms of the scenario we've been speaking of, that is (22-0)/(20-9)... i.e. 2
Ah... is nothing ever simple?
Think about the following numbers...
5, -5, 300, 15.7, 15.72342, one third, "pi", as in 3.1415...
In our day to day life, those are "just numbers". Few of us have got beyond elementary school, and thus still dislike "fractions", but even so, they're still "just numbers", even if yucky numbers.
When you put numbers into computers, a whole bunch of question arise about how you are going to turn even the short list I gave above into 1s and 0s. Some schemes work well for a whole bunch of types of numbers... but they tend to be complex, use up memory and storage, and have associated speed penalties. Simple, efficient, fast schemes tend to suit only a limited range of numbers.
Everything we've done so far has been "computer friendly". I've used byte, word and integer data types quite deliberately, always using the "best" type (in the narrow, programmer's sense of that word) for any given need.
Now, however, as part of our scaling wants, a division is involved. Sigh. That leads to "difficult" (for the computer, too) numbers.
So what we're going to do is this: We're going to take our nice byte-, word-, and integer- type numbers, turn them into "real"(-type) numbers... using that term "real" in the broad "mathematician's" sense, not the narrow Pascal (Lazarus, Delphi) sense. (I will be using the Pascal "single" data type.
So... to repeat the heart of that!... we will turn our numbers into single-type numbers long enough to do the work that we need fractions for, and then we will "throw away" the single-type number we've arrived at when it has done its job.
I'll give you a specific example. Let's suppose we want to plot a price of, say, $25 on our graph. And that the combination of all the relevant things means that we need to subtract 5 and multiply by 5/15 to get the offset from the x-axis line for the Y coordinate for that data point. We will have 0.3333 stored in a variable, we'll call it siScY (for "Single-type data, Scaling factor, Y coordinate). We will do...
25 minus 5 times siScY
... which comes to 6.666..
And so we will put that data point 7 units above the x-axis line.
Not so very "difficult" in underlying principle, just hard to express succinctly, if you're trying to convey the why behind the what.
And the program isn't so very complex, either... even though it will look pretty dreadful, especially as "the numbers" we want to work with are starting as things like....
iBitMapFrmHumY(7)
We will, of course, use functions... one to convert from our raw data to an X coordinate, one for converting to a Y coordinate.
I wrestled with something here.
At the moment, while we still have artificial data which doesn't need scaling, we plot a data point thus...
Image1.Picture.Bitmap.canvas.pixels
    [iBitMapFrmHumX(20),iBitMapFrmHumY(7)]:=
         Image1.Picture.Bitmap.canvas.pen.color;
The "Pixels" method is built into Lazarus, and assumes that if you give it, say, 5 and 12, you want to color in the pixel 5 across, and 12 down on the bitmap.
iBitMapFrmHumX, and iBitMapFrmHumY are our functions, which take our raw data and convert it to suitable numbers for the Pixels method. All this we have discussed. Those functions could be simple because I'd "cooked the books" and provided only data which would, without scaling, fit nicely on a sensibly sized (if rather small) bitmap.
Half of me wants to be "clever", and do an all singing, all dancing function, and do both the scaling and the conversion from x, y numbers we might recognize the x, y coordinates needed by Pixels. (Different range that the numbers in their raw state, and Y coordinate "flipped" so that small raw numbers turn into big converted numbers, and vice versa, because the Y numbers on a bitmap go UP as you go DOWN the bitmap- the opposite to the way we usually draw graphs.
The programming artist in me has a "gut feeling" that there might be advantages to "all in one" functions. Specifically, we might get a better mapping between raw numbers and final bitmap.Pixel coordinates.
And then the programming scientist in me says "No! Divide and conquer!"
At one point in the design process, I thought I'd go ahead with the "Divide and conquer" approach. I was going to take our existing....
Image1.Picture.Bitmap.canvas.pixels
[iBitMapFrmHumX(20),
iBitMapFrmHumY(7)]:=
Image1.Picture.Bitmap.canvas.
pen.color;
... and make it....
Image1.Picture.Bitmap.canvas.pixels
[iScaleX(iBitMapFrmHumX(20)),
iScaleY(iBitMapFrmHumY(7))]:=<
br>
Image1.Picture.Bitmap.canvas.
pen.color;
That "should" be possible. It "should" only require....
function Tld008f1.iScaleX(iConvert:integer):integer;
//ver 13 May 14, 16:18... see LT3Nf.htm, if you need to alter.
var siTmp:single;
begin
  siTmp:=(iConvert-iScXOffset)*siScXStretch;
  iTmp:=trunc(siTmp);
  result:=iTmp;
end;
(and something equally simple for iScaleY, just different constants.)
It really "should", I think, work that way... if you can provide the right scaling constants in iScXOffset and siScXStretch... which I'm not at all sure about.
(Please note... I am skipping over some details of my assumptions. (Really!) You will have to be very on your toes to take this program and re-purpose it for different sorts of data than the data I told you at the beginning that this program would handle.)
(Sidebar ends)
The sidebar, above, if that's not an oxymoron, went into some of my thinking which boils down to the following:
In developing this program, I got to a stage where I knew there were at least two ways forward. One "felt right". The other adhered to rules I know to be good.
One was complex, fraught with ways to go wrong, and potential hard-to-debug complex messes... but it was a path which might have been "necessary". I knew there was a way through by that plan... but could I find it?
The other path kept the rules, but there was one little "niggle"... how hard would it be to come up with, and maintain, the scaling constants.
I was puzzling over "Which way should I proceed?"
I realized that I hadn't taken my own advice, not in detail, not with the sorts of numbers I wanted to use "for real". So far we have been working with "make believe" numbers which were chosen to avoid some of the complexities that the real-world numbers introduce.
The advice I wasn't taking was to consider the extremes. See how everything works with the biggest and smallest numbers you want to use, see how you might handle them, and the other numbers will fall into place.
I had actually done that, without showing you, for the "make believe" numbers. Now it was time to do it for the real-world numbers....
The "raw", "real-world" X and Y which will give rise to a data point at the lower left of the graph will be something like 47800,5832. The first (X) number will always be "big", and an integer. The second (Y) number might be near zero, but will never be negative.
The "raw", "real-world" X and Y which will give rise to a data point at the upper right of the graph will be something like 49000,5832. The first (X) number will always be greater than the X number for the lower left corner, and an integer. The second (Y) number will always be greater than the Y number for the lower left corner, and an integer, perhaps as high as 5,000,000. (As I was typing this paragraph for the first time, I worked that out for the first time... way to late to be doing so. It might be a minor nuisance, requiring some re-working of data types I laid down earlier. Sigh. Oh well... will help me learn the lesson of "know where you are going before you start the journey. I should have looked more closely at my potential data range earlier.
So: Lower left: 47,800 / 5,832
Upper right: 49,000 / 5,000,000
If we are working with a bitmap that is 45 x 30, and if we have a left margin of 6 and a bottom margin of 4, and axis lines which are 1 pixel wide, those numbers need to be converted, to (roughly... there may be errors-of-one in the following)...
    Lower left             Upper right
   X        Y     ~       X         Y
47,800    5,832   ~    49,000  5,000,000 Raw numbers
   0        0             30         20  "Graph Area" coordinates
   6       26             39          0  Bitmap coordinates
Yes, Virginia, you really do have to look at these things that closely.
Working out the numbers with a pen on a sheet of paper is easier than doing them with a keyboard, it must be said.
In trying to come up with those figures, I "just naturally" went from the raw to the Graph Area to the bitmap. That doesn't mean that I've automatically come up with the best sequence... but I will investigate that first, as it seems "logical" to me.
How hard is it to get from the raw numbers to the Graph Area coordinates (GACs)? Or, alternatively, how hard is it to get from the GACs to the bitmap coordinates (BMCs)?
Well... From GAC to BMC: not hard at all. We've already written functions for this. So let's think closely about the raw numbers to GACs conversion....
It will entail a division, and thus the number-type nuisance. Not insuperable. To make the conversions, we'll need to know the range of the "input" numbers. We can manage that. We need to know the range, the limits, of the "output" numbers that we want... Umm.. Yes! We can access those, to!
So it looks like our algorithm should be....
Take raw numbers, convert to Graph Area coordinates. We will make iScaleX and iScaleY do this, by setting up the constants they use accordingly.
Take Graph Area coordinates, convert to bitmap coordinates.
We could write, for, say, the X coordinate, and ignoring the prefix to indicate number type, for the moment....
Tmp:=RawToGAX(RawX);
Tmp:=GAtoBitmapX(Tmp);
... as long as we write functions "RawToGA" and "GAtoBitmap".. which I know I can do.
The above can be made more compact....
Tmp:=GAtoBitmapX(RawToGAX(RawX));
.. and it will be a CLOSE relative to that, and something similar for the Y coordinate, which will be at the heart of the datapoint plotting routine in our final program.
Courage, mon braves!!
It seems I have reinvented some wheels in the course of the recent discussions. Earlier, I generated iBitMapFrmHum, which has "reappeared" out of the above theoretical discussion under the name "GAtoBitmapX. And earlier, I generated the "iScaleX" function, which did what the theoretical GAtoBitmapX function should do.
As an exercise in seeing that all is REALLY well, that the earlier "testbed" functions really do do all that is needed for plotting the datapoints, I am going to being in the new functions, and gradually weed out all traces of the original ones. Amazing what "little details" you sometimes "trip over" during such development work. Sigh.
For a little while, I am not going to take you line by line through the development process. Sorry!
Now "all" that's left, for this part of the programming, is to put into effect what the above careful work has planned. And "weeding" the "scraps" of the prototype functions iBitmapFrmHum and iScale. Because of the care during planning, we "should" not have trouble with it working. There will be a little work to incorporate all we planned, and do everything at the right time and place, but no task should be bigger than my brain can hold at one time.
Particular care will be needed over the determination of the constants we will be using, both in the GAtoBitmapX and RawToGAX functions, and their "Y" cousins. We must get the RIGHT constants, and we must re-calculate them at the right times.
The RawToGAX constants need recalculation whenever we change the set of raw data to be displayed.
The GAtoBitmapX constants need recalculation whenever we change the dimensions of the Graph Area, either because we've changed the size of the bitmap, or because we've chosen different margin sizes or axis line widths.
Tedious detail. No Rocket Science.
As I said, we've already done the GAtoBitmapX (and -Y) functions once. (As iBitMapFrmHumX and -Y.) We'll need to look closely at what worked for the sample data, make sure it is still all we need, but I don't anticipate any big hassles.
I have no regrets about going into such detail above. It shows you what is a Very Good Idea, and it has made sure that I really know where I am going.
A small thing....
We had a number of lines like...
Image1.Picture.Bitmap.canvas.pixels
    [iBitMapFrmHumX(9),iBitMapFrmHumY(13)]:=
         Image1.Picture.Bitmap.canvas.pen.color;
... for plotting individual points on the graph.
I'm changing that, first to...
wTmpX:=9;
liTmpY:=13;
Image1.Picture.Bitmap.canvas.pixels
    [iBitMapFrmHumX(wTmpX),iBitMapFrmHumY(liTmpY)]:=
         Image1.Picture.Bitmap.canvas.pen.color;
... and when I've done all that needs to be done to have that in place, I will go a further step...
I will put all of "the stuff" in a small procedure which I'll call PlotDataPoint, with a word and a longint passed to it, and so where ever I want to plot a datapoint, the coder will only see....
 wTmpX:=9;
 liTmpY:=13;
 PlotDataPoint(wTmpX,liTmpY);

 wTmpX:=11;
 liTmpY:=13;
 PlotDataPoint(wTmpX,liTmpY);

.. etc...
...unless he/ she chooses to delve more deeply.
That is possible once....
procedure Tld008f1.PlotDataPoint(wX:word;liY:longint);
begin
  Image1.Picture.Bitmap.canvas.pixels
    [iBitMapFrmHumX(wX),iBitMapFrmHumY(liY)]:=
         Image1.Picture.Bitmap.canvas.pen.color;
end;
... is available.
The other benefit of this rearrangement is that as I make the PlotDataPoint process more complex (to introduce the re-scaling we've discussed), all of the work of that is in one place. I won't be editing multiple lines which should all have similar code on them.
AND the process of supplying a "stream" of data pairs to the plotting process becomes more clear. At present, we are using a hardcoded series of Plot this, Plot this, Plot this... statements. Not brilliant, but nice and simple. We will be switching over to fetching our test data from a string, as discussed long, long ago at the start of this. If the "generate stream of data to plot" part of the program isn't quite so deeply tangled into the "how we plot one point, Things Will Go Better!
Eventually, we will need a flexible program, which can assess a data set, and alter the values in the scaling constants accordingly. For now, we are going to manage that part of the process by hand, but in a manner consistent with what we will want (and be able) to do later.
We have to change some of the data scaling constants whenever we change data sets. These are the constants which take, say, 47800 to 49000 and scale them down to 0 to whatever is the right hand column of the Graph Area at the time.
At this point, further variables must be introduced, to hold important information. I am adding....
The first will be largely a "placeholder" for the moment. In due course, it will tell us which company's prices are being watched. It is set in ChangeDataStep1, and at the same time a label is updated, so that the user knows what data is being looked at.
The "Max/ Min" variables are to hold the maximum and minimum X and Y values in the current data. For the moment, we are setting these by hand. In due course, the application will have to scan the data... only as far back as we want to look (The data files will be sorted, newest data at the top.)
The data types for the Max/ Min variables were dictated by the nature of the data we want the program to be able to handle.
Earlier, we put in place the code to revise various variables whenever we change the size of the Graph area. We can (indeed must) use some of the numbers from that work in our present work.
What are the scaling factors?
When do we re-calculate the scaling factors?
The right time for doing that is a time which is not yet represented in the program. We're going to change that, now. First add the buttons, etc, that the user will see....
Add a button. Call it buChangeData, label it Change Data.
Add two labels, call them laTxtDataSet and laDataSet. Caption them "Viewing:", and "laDataSet". The caption of laTxtDataSet won't change: That label is just to, umm... label... the OTHER label, the contents of which WILL change, to tell us what data set, i.e. what company's prices, we are looking at.
But don't worry... we aren't actually going to implement ALL of changing data sets, yet. Just put in place the program structures where that stuff WILL go.
As with anything, there's a complex web of initializations to get right.
As part of the Change Data (set) process, we will recalculate the scaling factors. But we can't do that until the variables which depend on the Graph Area's size are established. But if they (GA variables) change, we must recalculate the scaling factors. All very tedious. We just have to take it step by step.
At the moment, we have the subroutine EstablishBitmap, in which the GA variables are filled. It is called during the FormCreate handler, and if we click on the ResizeIt button.
We are, "of course", going to put the ChangeData code into a self contained procedure... ChangeData. Actually, it emerged (not the ideal way to "program") that what I envisioned for "ChangeData" was in two parts, one of which was appropriate in some places, the both of them being needed in others. Some messy, and potentially bug-introducing, work ensued in which ChangeData was broken into ChangeDataStep1 and ChangeDataStep2.
The original plan was: "We will call ChangeData during the FormCreate handler, just after we have executed EstablishBitmap." That too required re-thinking. Not all of that may have made it into this essay, but, I hope, all of the required finer points are now in the sourcecode, which will be listed in full, for this stage of the application's development, a little further down the page.
We will call ChangeData if someone clicks the Change Data button. Do you see the OTHER place we need parts of it? Yes! In the code executed upon a "Resize".
"Parts of it"... that's ominous. And messy. Instead of trying to do exactly what I said above, I'm simply going to slightly revise it.
We will have TWO procedures which, between them, do all of the ChangeData tasks. I'm giving them the rather unimaginative names of ChangeDataStep1 and ChangeDataStep2.
Part one will, eventually, allow us to switch to a different set of data, and it will assess that data to establish the biggest and smallest X and Y values present in it. Eventually, it will have a parameter which will either direct it to access the data of a particular stock, or to allow the user to interactively specify which stock should be looked at next.
ChangeDataStep2 will take the maxima and minima determined in Pt1, combine them with other values, and generate the scaling factors we need for the functions which, in two stages, turn raw data points into bitmap coordinates, as extensively discussed previously.
We must call both parts.. directly or indirectly... during the FormCreate handler. We must call both parts if we want to change the data set.
It is because we only need to call the second part when we do a Resize that the whole business of splitting ChangeData into two parts was done. (if we are only resizing, the information collected during Pt1 hasn't changed, has it?
Well... here I sit typing after about a week of working on this. And I'm about to ignore my own advice, even though I KNOW it will come back to haunt me.
It doesn't work.
Well... not quite correctly, anyway.
What we have so far is a pretty good set of routines to draw a re-sizable graph.
But there's something not quite right in the scaling of the data. The scaling in the X direction may be NEARLY right. I have a "+1" which I snuck in, 'cause it "made things work". The datapoint associated with the smallest X value, and that associated with the largest X value now appear at the left and right of the graph area. Good! (Not thoroughly tested, but "seems to work."... which is one of those phrases which you should be sensitive to. When you find yourself using it, you are probably trying to gloss over something that you need to re-examine.)
The scaling in the Y axis isn't as good. The biggest Y doesn't plot at the top of the screen, and the lowest plots on or below the Y axis, or even below the bitmap entirely. (In which case, there is no "problem"... we just don't see the datum.)
And I really, really should get to the bottom of these issues, fix them.
But I'm not going to.
I genuinely always intended to have a band of white above and below the plotted data points, and to the right of them. For now (famous last words), I am going to rely on the provisions for them to take care of the shortcomings in my scaling formulae (another dangerous assumption... how do you know where the problem is, unless you know what the problem is?)... going to rely on those provisions to be enough, so that I can go on to the more interesting (to me) question of the two "boundary" lines.
I DO have confidence that the program is sufficiently well built that the problem which is leading to the unexpected scaling will be isolated, probably in the formulae in ChangeDataStep2 which calculate siScXStretch and siScYStretch, and that one day I will be able to see what is wrong with them, and get that part working better. And if the issues are isolated, as I hope, then a fix there won't have cascading effects and mess up other things. If I find myself having to incorporate further fudges to accommodate earlier fudges, I hope I will show the craftsmanship to say "enough!", and go back and fix what I am leaving behind now.
P.S.: Later, I found part of the problem. As ever, cheats never prosper. Instead of having the computer scan the data it was going to plot, and RELIABLY find the maximum and minimum Xs and Ys, I was doing that by hand... and I hadn't put in the right numbers. Putting in the right numbers, plus a new "+1" kludge helped... but didn't entirely fix the problems.
We current have a program which will "auto-fit" our data points, and produce....
{{To be inserted here: Image of a graph with datapoints nicely filling graph area}}
What would be even better for my purposes is a graph with space above, below, and to the right of the data points....
{{TO BE INSERTED HERE: Image of that
To create what I want is quite simple. As ever, I want to put critical numbers into variables, and as ever I want to work in multiples, not absolute increments. In other words I don't want to say "make the blank area to the right of the plotted points say 100 wide", I want to say something like "make the blank area to the right of the plotted points 40% of the width of the GraphArea.
I'm setting up three new variables...
They are all "byte" type variables. The numbers in them are percentages.
If I were to set them to...
... I would want the graph to draw with a blank region the right of the datapoints consisting of 40% of the width of the GraphArea.
The other two numbers should be interpreted to achieve 20% of the height of the GraphArea being blank above the plotted data points, and 10% of the height of the GraphArea below the data points being empty
{{INSERT HERE: DIAGRAM OF SAME}}
Happily, unless I'm missing something, all of this can be achieved just by inserting a little code between....
... and...
(I WAS missing something... but not too much. I'll explain in a moment. That was indeed all that was needed to achieve the blank area to the right of the data points.)
We will "lie to" the formulae which are determining our scales. We will "pretend" that we have some X and Y values bigger and smaller than the actual maxima and minima, and achieve our blank areas that way.
To take some exceedingly convenient numbers as an example, assuming the blank area percentages I said I wanted....
Suppose our X values actually go from 0 to 59... We'll "tell" the scaling formula that they go from 0 to 99.
And suppose that our Y values go from 100 to 790. We'll "tell" the scaling formula that they go from 0-1000.
Of course, in the "real world" the numbers will be messier. But the amount of "extra" X and Y to add in the various places shouldn't be hard to incorporate.
At the moment, with no provision for the blank areas, the relevant parts of ChangeDataStep2 look like....
procedure Tld008f1.ChangeDataStep2;
begin
  wScXOffset:=wXMinRaw;
  liScYOffset:=liYMaxRaw;
  siScXStretch:=wGrGAWidth/(wXMaxRaw-wXMinRaw+1);//The "+1" is a KLUDGE...
  //with it, the range isn't stretched TOO far. (Without it, the last
  //data point is off the edge (or top... bottom(?) of page.)

  //showmessage(inttostr(wGrGAHeight));
  siScYStretch:=wGrGAHeight/(liYMaxRaw+1-liYMinRaw);//The "+1" is a KLUDGE.
  //showmessage(inttostr(round(siScYStretch*1000)));
end;
We're going to start with a crude implementation. We'll make the space to the right of the cloud of plotted points as wide as the cloud, and an area above, and an area below as high as the area of the cloud. Here's what the code for that looks like...
procedure Tld008f1.ChangeDataStep2;
var wFakeXMax:word;
    liFakeYMin,liFakeYMax:longint;
begin

  wFakeXMax:=wXMaxRaw+wXMaxRaw;
  liFakeYMin:=liYMinRaw-liYMinRaw;
  liFakeYMax:=liYMaxRaw+liYMaxRaw;

  wScXOffset:=wXMinRaw;
  liScYOffset:=liFakeYMax;

  siScXStretch:=wGrGAWidth/(wFakeXMax-wXMinRaw+1);//The "+1" is a KLUDGE...

  siScYStretch:=wGrGAHeight/(liFakeYMax+1-liFakeYMin);//The "+1" is a KLUDGE.
end;
That takes care of most of the "create-gaps" work... all of it in the case of the X axis, but not quite all of it in the case of the Y axis.
Take a moment to think deeply about the whole scaling process. And as you think about it, don't assume that what I've said and done above is 100% right. it has a problem at the upper end of the mapping process. A "too small to matter" problem, with the sort of numbers I want to work with, and with the blank areas around the plotted data points... but that "small" problem will come back to haunt me one day. Sigh.
Let's say we have data with X=100, 110, 120, 130, 140, 150, 160, 170, 180, and 190. (We'll think about the Y part another time.) Ten points to be plotted. Numbers from 100 to 190.
Let's further say that want to plot these on an X axis consisting of 10 pixels, the first being number "0", the last being... if there are 10... number (or "index") "9".
The way to tackle such things is first to "slide" all the numbers you want to plot down (or, in some cases, up) so that the first one will go on the first pixel. So: Using CAPITAL A to stand for the number we start with, and a lower case "a" to stand for the number we need to turn it into, to get the points plotted on our 11 pixel-wide GraphArea, we start by taking 100 off of each number.
The data with value 100 (A=100) will be plotted in the column of pixel 0 (a=0)... just because of the "sliding" step, as long as the next step doesn't change then number we get from "sliding", which it won't, as you will see.
But! We not only need to "slide" the data, we also need to squeeze (or, sometimes, stretch) it. In this case, we can "just see" that a factor of ten is what we need.
Where A=190, we start by taking off 100... that brings the number down to 90. We then divide that by 10... making a=9... which tells us that the data for A=190 should be plotted in pixel NUMBER nine's column, i.e. the tenth column. a=9.
So far, so good. All works nicely with nice tidy numbers. And of course, we have to work out what the rules are for how much to slide, and how much to squeeze or stretch.
But even before we do that, there's another problem.
Take the same case we have been working on. What column of pixels do you use for a data point where the X value is 152. Probably column 5, UI would guess. Or 158? That may turn out to be column 6 if we are rounding, or column 5 if we are truncating. (Trun(5.8) is 5). And it will sort of work either way, as long as we are consistent, in the middle part of the graph. But what happens at the ends, especially the top end? Probably, if we use truncation, which is my gut instinct, ONLY data (in our example) with an X value of 190 will plot in that last column. Whereas for every other column, there is a range of 10 numbers which all result in a data point in that pixel column. Hmmm. I hate inconsistencies. They often come back to haunt you.
But I'm leaving that there for now, for the same reasons I've fudged a few other things in this department.
Fine. (Almost) when the problem is as simple as "How do we map 100-190 (inclusive) onto 0-9". However... the same rules apply, even for more complex numbers. It is just harder to be sure that you have the offset and scale numbers right.
That's enough Deep Thinking for the moment. Let's get back to making it work.
We already (mostly) had things working to fill the GraphArea with our data. We'd started working on creating empty areas on three sides of the cloud of data points.
We got part way to "the answer" by "lying" to the program, and telling it that the range of numbers in X and in Y was greater than it was. This did the job for the gap to the right, and it expanded the scale in the Y dimension.... but the datapoints were all at the bottom of the GraphArea. Both of the horizontal bands of empty space were above the data points.
All we need to do is to "push" them up the page a bit. We don't want to change how much they've been stretched or squeezed. It is almost as if we want to change the program's idea of where Y=0. That isn't exactly what we're doing, but it is close. We are changing where, in pixel units, we want the lowest plotted points.
And the place to "push up" the Y's is in iGAtoBitmapY. Previously, our pixel=0 row and out "put smallest Ys here" row was the same. Now we want the smallest Ys further up the page... which means a SMALLER pixel row number, remember. Sigh.
Our new will be....
result:=(wGrGAHeight-iConvert-1)-iGrBelowDataCloudGap;
... but that just gives a name to the problem. We need to put a number in that "iGrBelowDataCloudGap" variable. And we do that in ChangeDataStep2
Lesson in program development: While building this, I first just made iGrBelowDataCloudGap 10, and ran some tests to see if even that would work as expected... and it did. Which meant it was safe(-er) to go forward with "being clever".
Quite a while ago we said that we didn't want just an "as wide as the data cloud" gap to the right of the data cloud. (And equally over-simple sizing of the gaps above and below the cloud). We said we wanted to determine the width and heights with...
Now that we've got the basics (mostly) working, we can get "fancy". We'll start with the X gap, because our requirement is simpler (just a blank area to the right of the data cloud) AND the X aspect is easier because we don't have to deal with the wretched inversion issues.
Our old, fixed-sized gap answer came out of "mis-reporting" the maximum X value in the data. Doubling it, with the test data we were using "squashed" the plotted data down into roughly the lower half of the area available. (If our X data had run from, say, 780-999, I bet the width of the blank area to the right of the data cloud would have been much more than half of the total X axis. But that's a story for another time.
We've chosen to express the width of blank area we want as a percent. If we say bGrGapRight:=40, we expect the datacloud to take the first 60% of the width of the screen.
We have already analyzed WHAT numbers we need, WHEN to obtain them, and WHERE to apply them.... to achieve our blank area at the right of the data cloud.
WHAT we need is a value in iGrBelowDataCloudGap.
And this is how we calculate it.
We will start with what range of X values were going to be mapped onto the pixels we have available? (That comes from wXMaxRaw-wXMinRaw. Let's say that in the present case it is 1260.) And we need the number from bGrGapRight, let's say 40(%) for working the example.
Now, on the road to what wee need to add use for wFakeXMax. we say, "Well. if 1260 is 60% of the number we need, then we what we need to add is 1260/60)*40... 840". More formally, and generally, that is...
  siTmp:=(wXMaxRaw-wXMinRaw)/(100-bGrGapRight);
  iTmp:=trunc(siTmp*bGrGapRight);
  wFakeXMax:=wXMaxRaw+iTmp;
That code goes very near the beginning of ChangeDataStep2, but after bGrGapRight, bGrGapAbove and bGrGapBelow have been given values.
Now for the gaps above and below. Sigh.
We already have them working, sort of, remember.
But for the Y gaps, we need three numbers. We need liFakeYMin and liFakeYMax for the purposes of ChangeDataStep2. (We need them to calculate siScYStretch) And we need to calculate iGrBelowDataCloudGap, which is used in iGAtoBitmapY to "push" the data cloud up.
Our method will be similar. We know what gap, as a percent, we want above. Call it, for this, TopGapPercent. We know what gap, as a percent, we want below. Call it, for this, BelowGapPercent. So the percent of the Y axis occupied by the datacloud, as a percent, will be 100-TopGapPercent-BelowGapPercent. We know the range of raw Ys which will be going into creating the data cloud (liYMaxRaw-liYMinRaw). And with all of that, we can know how much to expand the range of "supposed" Y values, so that the numbers for making the data cloud AND the top and bottom gaps fill the required range of pixel rows.
And finally, we know how many units (in the units of the raw data) of the Y axis is devoted to the bottom gap. Originally I said: "It can't be hard (we'll find out!) to convert that to pixels-dedicated, to put in iGrBelowDataCloudGap." Well, actually it was, going by that route. But there was a MUCH simpler route, which you can see in the code below.
Hmmm. Good theory. I hadn't done it yet, at the time I'd just written out the above for you, to help you see how programs are developed.
(Some time later....)
Whew! That bit done. Less than the usual hassle. Code for it...
  liTmp:=liYMaxRaw-liYMinRaw;
  siTmp:=liTmp/(100-bGrGapAbove-bGrGapBelow);
  liTmp:=trunc(siTmp*bGrGapAbove);
  liTmp2:=trunc(siTmp*bGrGapBelow);

  liFakeYMax:=liYMaxRaw+liTmp;
  liFakeYMin:=liYMinRaw-liTmp2;

  wScXOffset:=wXMinRaw;
  liScYOffset:=liFakeYMax;

  siScXStretch:=wGrGAWidth/(wFakeXMax-wXMinRaw+1);//The "+1" is a KLUDGE...
  //with it, the range isn't stretched TOO far. (Without it, the last
  //data point is off the edge (or top... bottom(?) of page.)

  siScYStretch:=wGrGAHeight/(liFakeYMax+1-liFakeYMin);//The "+1" is a KLUDGE.

  siTmp:=(wGrGAHeight*bGrGapBelow)/100;
  iGrBelowDataCloudGap:=trunc(siTmp);
... and all of iGAtoBitmapY is now...
result:=(wGrGAHeight-iConvert-1)-iGrBelowDataCloudGap;
(The minus 1 in that is a kludge, unrelated to the "make blank area at bottom" bit.)
User will, of course, be able to change the values in the blank-area-sizing variables. Implementing that should be (famous last words) easy, because as I was doing the early work, shown above, I was looking ahead, planning the user access.
Long, long ago, I presented, in isolation, a way to provide a program with data.
Then, until now, I didn't use that, choosing instead to get LD008 "working" with a very simple, very small, data set.
Now the time has come to change where the application gets it's data, how it uses it. We won't go to the final stage yet, but we will be very close to it when we finish the next material.
Before I make those major changes, I am going to save LD008 as "finished", and move on to LDN009 for the "bigger and better" version.
We will be making some changes in DrawGraph.
At the moment, it just marches through some hard-coded triplets of statements, e.g....
wTmpX:=9;
 liTmpY:=13;
 PlotDataPoint(wTmpX,liTmpY);
... one triplet for each data point.
Very crude. Very easy to implement, understand.
We're going to move to something like the following. I am not using the variable names I will use in due course. And this is pseudo-code, not, unless there's been a coincidence, valid Lazarus code...
Fetch a data record. (A date and a price, put Date and Price)
If invalid then report that,
   else begin
      repeat
         PlotDataPoint(Date,Price);
         Fetch a data record
       until newly fetched date is too old, or
          file is empty
   end else
Before the code which will be crafted from that can work, we need to ensure that elsewhere (and the right elsewhere) we always open the data stream, and set the "where to find next record" pointer pointing at the first record. We need to have the program aware of what "too old" would be.
And after the data has been read, we will close the data stream, expecting to re-open it again, later, if we want to look at the data again.
The data in the file must be in reverse chronological order for the plan to work. I will probably arrange for the oldest possible date to be stored in a rogue record at the end of the file. This should stop the program from ever trying to read the record "after" the last record... but the programming should be robust enough to handle that case, should it arise.
"Simple" enough plan. Ha. Now I am going to go away and implement it, without doing all the detail you have been getting in the other parts of this tutorial.
Some details of the variables, etc, used to implement the above...
While I am still using the "fake" datasource, as described in the early part of this tutorial (LDN007), the pointer telling the system where to go for the start of the next data record will be in wWhereInData. The data will be in the constant sDataSource. The value in wWhereInData will simply be the offset into the string. If the record we want to read next is the first in the string, wWhereInData will equal zero. If the record we want next starts at the 15th character of the string, wWhereInData will be 15. (The 15th character might well be called "Character 14" in some contexts, as the first is probably "Character 0"... but for our needs, the "usual", "human" way of counting the characters is more suitable.)
When the final version is done, I won't need to keep wWhereInData manually. The system will keep track of that for me... but it will be kept track of somewhere.
Dates are stored in the program as word type values. The oldest date we want to have in the display is held in wOldestToDisplay. That, notice, is inclusive.
The sourcecode, after setting things up to fetch data from the constant sDataSource, looks as follows. If you decide to run it, be advised that you have to look closely for the datapoints on the graph, they are just single pixels... but I think you will find that they are there, after you've clicked "Do It"
unit LD009u1;

{$mode objfpc}{$H+}

interface

uses
  Classes, SysUtils, FileUtil, Forms, Controls, Graphics, Dialogs, StdCtrls,
  ExtCtrls;

const vers='10 May 14- Earliest state';
  //Extension of LD008... a graph drawing application. In this form,
  //   it draws its data from a constant, sDataSource.


  sDataSource='41746-2300/41745-2280/'+
    '41744-2270/41743-2265/41742-2270/'+
    '41741-2245/41740-2198/41739-2196/41738-2195/41737-2190/41736-2180/'+
    '41735-2155/41734-2158/41733-2165/41732-2175/41731-2180/41730-2175/'+
    '41729-2180/41728-2175/41727-2180/9999-1000/0000-1000';


type

  { Tld009f1 }

  Tld009f1 = class(TForm)
    buQuit: TButton;
    buDoIt: TButton;
    buResizeIt: TButton;
    buChangeData: TButton;
    Edit1: TEdit;
    eWidth: TEdit;
    eHeight: TEdit;
    Image1: TImage;
    laAppInfo: TLabel;
    laTxtDataSet: TLabel;
    laDataSet: TLabel;
    laTxtWidth: TLabel;
    laTxtHeight: TLabel;
    laVer: TLabel;
    procedure buChangeDataClick(Sender: TObject);
    procedure buDoItClick(Sender: TObject);
    procedure buQuitClick(Sender: TObject);
    procedure buResizeItClick(Sender: TObject);
    procedure FormCreate(Sender: TObject);
  private
    { private declarations }
    Bitmap:TBitmap;
    liScYOffset,liPrice:longint;//-2x10^9 to +2x10^9, smallest able to hold
    //the numbers I may present for price-in-pennies. (word can only cope
    //with up to $655.35, (in pennies: 65535)
    iTmp,iImageLeft, iImageTop, iImageWidth, iImageHeight:integer;
    bGrAxWidX,bGrAxWidY,bGrGapRight,bGrGapAbove,bGrGapBelow:byte;
    wGrMarBott,wGrMarLeft,wGrGAWidth,wGrGAHeight,
    wOldestToDisplay,wWhereInData,wDate:word;
    iScXOffset,iGrBelowDataCloudGap:integer;
    sTmp,sDataSet:string;
    wXMaxRaw, wXMinRaw:word;
    liTmp,liTmp2,liYMaxRaw, liYMinRaw:longint;
    wScXOffset:word;
    siTmp,siScXStretch,siScYStretch:single;
    procedure EstablishBitmap;
    procedure DrawGraph;
    function iBitMapFrmHumY(iConvert:integer):integer;
    procedure DrawXAxis;
    procedure DrawYAxis;
    procedure MoveLineToAndInclude(iX1,iY1,iX2,iY2:integer);
    function iScaleX(iConvert:integer):integer;
    procedure PlotDataPoint(wX:word;liY:longint);
    procedure ChangeDataStep1;
    procedure ChangeDataStep2;
    function iRawToGAX(wConvert:word):integer;
    function iRawToGAY(liConvert:longint):integer;
    function iGAtoBitmapX(iConvert:integer):integer;
    function iGAtoBitmapY(iConvert:integer):integer;
    procedure ReadRecord(var w1:word;var li1:longint);

  public
    { public declarations }
    end;

var
  ld009f1: Tld009f1;

implementation

{$R *.lfm}
{$R+}//Enable range checking

{ Tld009f1 }

procedure Tld009f1.FormCreate(Sender: TObject);
begin
  laVer.caption:='Version '+vers;

  //Variables related to the TImage object...
  //See https://sheepdogguides.com/lut/lt1Graphics.htm for details
  //  of using a bitmap as a drawing surface to work with...

  iImageLeft:=32;//Set initial values for core variables
  iImageTop:=120;
  iImageWidth:=200;
  iImageHeight:=120;

  bGrAxWidX:=1;
  bGrAxWidY:=1;
  wGrMarBott:=4;
  wGrMarLeft:=6;

  ChangeDataStep1;//Must happen BEFORE EstablishBitMap can occur
  EstablishBitmap;//Must happen AFTER core variables have values
  //ChangeDataStep2;Is done during EstablishBitMap

end;

procedure Tld009f1.buResizeItClick(Sender: TObject);
begin
  Bitmap.destroy;

  iImageWidth:=strtoint(eWidth.text);
  iImageHeight:=strtoint(eHeight.text);

  EstablishBitmap;
  //ChangeDataStep2; This happens inside EstablishBitmap.
end;

procedure Tld009f1.EstablishBitmap;
//A purist would pass things like iImageWidth to this procedure
//   as parameters. I am "breaking the rule" deliberately,
//   judging the value, here, not worth the nuisance.
//Besides Establishing the bitmap, this routine changes the
//   values in some variables referred to elsewhere when
//   scaling things to fit graph well.
begin

  Image1.left:=iImageLeft;//Set size and posn of TImage control
  Image1.top:=iImageTop;
  Image1.width:=iImageWidth;
  Image1.height:=iImageHeight;

  Bitmap:=TBitmap.create;//Create a bitmap object

  Bitmap.width:=iImageWidth;//Adjust dimensions
  Bitmap.height:=iImageHeight;

  //In Delphi, bitmap background is white to begin with. Black in Lazarus
  Bitmap.canvas.pen.color:=clWhite;//1 of 2 lines not needed in Delphi...
  Bitmap.canvas.Rectangle(0,0,iImageWidth,iImageHeight);//2 of 2 not needed, Delphi

  Image1.Picture.Graphic:=Bitmap; //Assign the bitmap to the image component
  //Note how we have adjusted the size of the image to the size of the bitmap
  //   we will be assigning to it.

  //Now fill two variables with values for the width and height of the
  //  "Graph Area", i.e. that part of the bitmap to the left of, and
  //  above the two axes.
  //If there are 15 rows of pixels and and 25 columns of pixels in the
  //  Graph Area, then you would set wGrGAWidth:=15, wGrGAHeight:=25

  wGrGAWidth:=iImageWidth-wGrMarLeft-bGrAxWidY;
  wGrGAHeight:=iImageHeight-wGrMarBott-bGrAxWidX;

  //At this point, ChangeDataStep2 must be called to recalc the scaling
  //  factors, but ChangeDataStep1 doesn't need to be called every
  //  time we are doing EstablishBitmap because sometimes
  //  we are still dealing with the same data, and any data changing
  //  or assessing the range of values in the data takes place in Pt1
  ChangeDataStep2;

end; // of EstablishBitmap

procedure Tld009f1.PlotDataPoint(wX:word;liY:longint);
//This procedure does access external "constants" as well.
//X was put in a word-type variable, and Y in a longint
//   because of the data anticipated in the specific
//   application this was written for. (Word wasn't big
//   enough for some of the Y data.)
var iTmpXL,iTmpYL:integer;
begin
  iTmpXL:=iGAtoBitmapX(iRawToGAX(wX));
  iTmpYL:=iGAtoBitmapY(iRawToGAY(liY));
  Image1.Picture.Bitmap.canvas.pixels
    [iTmpXL,iTmpYL]:=Image1.Picture.Bitmap.canvas.pen.color;
end;//of PlotDataPoint

procedure Tld009f1.DrawGraph;
begin
 Image1.Picture.Bitmap.canvas.pen.color:=clBlack;

 DrawXAxis;
 DrawYAxis;

 //Connect to data stream
 wWhereInData:=1;

 //Datastream is already validated... happened back in
 //  ChangeDataStep1 before max/mins found

 ReadRecord(wDate,liPrice);
 repeat
   PlotDataPoint(wDate,liPrice);
   ReadRecord(wDate,liPrice);
 until {out of data or}wDate<wOldestToDisplay;

 //Release connection to datastream

 //MoveLineToAndInclude(0,0,wGrGAWidth-1,wGrGAHeight-1);

end;//of DrawGraph

//======
function Tld009f1.iScaleX(iConvert:integer):integer;
//ver 13 May 14, 16:18... see LT3Nf.htm, if you need to alter.
//This no longer has a role in the code, but remains because
//  reference is made to a "iScaleX" function in LT3N.htm, a
//  tutorial explaining the development of this application.
begin
  siTmp:=(iConvert-iScXOffset)*siScXStretch;
  iTmp:=trunc(siTmp);
  result:=iTmp;
end;//iScaleX
//=========

procedure Tld009f1.DrawXAxis;
//Could be made clearer? Use wGrGAHeight/wGrGAWidth, or just work lineto in Bitmap units?
//Re-word DrawYAxis at same time
var bTmpL:byte;
begin
  for bTmpL:=0 to bGrAxWidX-1 do begin
  Image1.Picture.Bitmap.canvas.moveto
    (iGAtoBitmapX(-1),   iBitMapFrmHumY(-1-bTmpL));

  Image1.Picture.Bitmap.canvas.lineto
    (iImageWidth,          iBitMapFrmHumY(-1-bTmpL));
  end;//for
end; //DrawXAxis

procedure Tld009f1.DrawYAxis;
//Could be made clearer? Use wGrGAHeight/wGrGAWidth, or just work lineto in Bitmap units?
//Re-work DrawXAxis at same time
var bTmpL:byte;
begin
  for bTmpL:=0 to bGrAxWidY-1 do begin
  Image1.Picture.Bitmap.canvas.moveto
    (iGAtoBitmapX(-1-bTmpL),iBitMapFrmHumY(-1)+bGrAxWidX-1);

  Image1.Picture.Bitmap.canvas.lineto
    (iGAtoBitmapX(-1-bTmpL),-1);
  end; //for
end; //DrawYAxis

procedure Tld009f1.MoveLineToAndInclude(iX1,iY1,iX2,iY2:integer);
//If you call lineto(0,0,3,3), only pixels 0,0/ 1,1/ and 2,2 are
//  affected. This procedure, when called with the same parameters
//  affects all of those pixels AND pixel 3,3.
begin
  Image1.Picture.Bitmap.canvas.moveto(iGAtoBitmapX(iX1),iBitMapFrmHumY(iY1));
  Image1.Picture.Bitmap.canvas.lineto(iGAtoBitmapX(iX2),iBitMapFrmHumY(iY2));
  Image1.Picture.Bitmap.canvas.pixels[iGAtoBitmapX(iX2),
                    iBitMapFrmHumY(iY2)]:=Image1.Picture.Bitmap.canvas.pen.color;
end; //MoveLineToAndInclude

procedure Tld009f1.buQuitClick(Sender: TObject);
begin
  close;
end;

procedure Tld009f1.buDoItClick(Sender: TObject);
//In due course, the "DoIt" button can probably
//  be retired, if "DrawGraph" calls can be inserted
//  in strategic places... near the end of FormCreate
//  and ChangeData and Resize seem about right, on
//  limited reflection.
begin
  DrawGraph;
  end;

procedure Tld009f1.buChangeDataClick(Sender: TObject);
begin
  showmessage('In due course, user will have chance here to say '+
     'what data set to switch to. At the moment, there is just '+
     'the one data set. Consider yourself "switched"... from "a" to "a"!');
  ChangeDataStep1;
  EstablishBitmap;//to clear previous data from graph
  //ChangeDataStep2; Is done inside EstablishBitmap;
end;

function Tld009f1.iBitMapFrmHumY(iConvert:integer):integer;
//ver 13 May 14, 16:18... see LT3Nf.htm, if you need to alter.
//To be written out, replaced by iGAtoBitmapY. Make note in
//   LT3Nf at place where iBitMap... was developed when it is
//   written out.
begin
  //With iImageHeight=20, wGrMarBott=4, bGrAxWidY=1, the number that
  //  iConvert is taken away from should be 14.
  //The brackets aren't necessary for the mathematics, but are there
  //  to help you see the basic "trick" of inverting a series of
  //  numbers: take a varying but increasing "input" number away
  //  from a constant to obtain a varying but DEcreasing "output".
  iConvert:=wGrGAHeight-iConvert;
  result:=iConvert;
end;

procedure Tld009f1.ChangeDataStep1;
//Establish which data stream is to be read, and "connect" it.
//Do an analysis of the data, determine max and min X and Y
//Eventually set up with a parameter to say "This data", or
//  "Ask user which data".
//Update on-screen display naming the data set we are using.
begin
  sDataSet:='SampleData';//This will eventually be changeable,
  //  and will tell you what company's prices you are looking
  //  at, and will be part of designating which data file to read.
  laDataSet.caption:=sDataSet;//Tell the user what data we are reading.

  //The application is set up to scan data files, which must be in
  //  chronological order, oldest first. The application will not
  //  always read ALL of the data available. It will only scan back
  //  as far as it has been told to by the value in wOldestToDisplay,
  //  which users will, one day, be able to change as they wish.

  wOldestToDisplay:=41729;

  //"Connect" to data, and put pointer to "what record we want to read
  //    next to first record.
  wWhereInData:=1;
  //wWhereInData:=1; is all that's needed to "open the datastream" as
  //long as I am using the simple "data source" of the string sDataSource.
  //For now, we aren't using a data stream. We are hardcoding the data
  //So first two lines of comment in this block merely mark place of
  //    things to come
  //Put "prep to scan data" in a SR.

  //Close and re-open datastream between "Scan to find max/min" and "scan to plot"

  //Scan the data, determine max/min X and Y

  wXMinRaw:=65533;
  wXMaxRaw:=0;
  liYMinRaw:=99999;
  liYMaxRaw:=-5000000;

  ReadRecord(wDate,liPrice);
  //if invalid(ior wDate<wOldestToDisplay, report and abort rest. Else...
  begin// "1"
    repeat
      if wDate<wXMinRaw then wXMinRaw:=wDate;
      if wDate>wXMaxRaw then wXMaxRaw:=wDate;
      if liPrice<liYMinRaw then liYMinRaw:=liPrice;
      if liPrice>liYMaxRaw then liYMaxRaw:=liPrice;
      ReadRecord(wDate,liPrice);
    until {file is empty or} wDate<wOldestToDisplay;
  end;//begin "1"

  //showmessage('   wXMinRaw'+inttostr(wXMinRaw)+'   wXMaxRaw'+inttostr(wXMaxRaw)+
    //  '   liYMinRaw'+inttostr(liYMinRaw)+'   liYMaxRaw'+inttostr(liYMaxRaw));

  //Close connection to datastream. (Code WILL be needed... but not needed until
  //  using fancier data source than sDataSource
  end;

procedure Tld009f1.ChangeDataStep2;
//Work out the scaling factors needed for plotting, using
//  the current display area information (from variables)
//  and the current data set's characteristics (max and
//  min X and Y.

//The idea of the offsets and streches are to map data from
//  ranges defined by the Min/Max variables filled in ChangeDataStep1
//  to ranges which suit our graphing needs better... from 0 to the
//  maximum X or Y coordinate, as expressed in pixels.
//If, on say the Y axis, our data went from 10 to 110, and we had
//  pixels 0 to 10 available to display that data, the offset would
//  be 10, to bring 10 to 110 down to 0 to 100, and the scale factor
//  would be 0.1 to bring the 0 to 100 down to 0 to 10.
//The first row (or colum) of pixels in the display area will be
//  row or column "=0", at least as far as the plotting routines are
//  concerened. It can STAND FOR anything, of course, standing for
//  10 in the example developed above.
var wFakeXMax:word;
    liFakeYMin,liFakeYMax:longint;//These variables are not
    //really necessary, but I hope they help make more clear the
    //logic of how the blank areas on the graph are created.
begin
  //Fill the relevant variables with the values which determine
  //  the size of the blank areas above, below, and to the
  //  right of the cloud of plotted data points.
  //These numbers are "percents", in other words, if
  //  bGrGapRight is set to 40, then the right hand 40% of
  //  the width of the GraphArea should be blank.
  bGrGapRight:=40;
  bGrGapAbove:=20;
  bGrGapBelow:=20;

//Deal with creating blank area to right of data cloud
//Everything relevant is here.
  siTmp:=(wXMaxRaw-wXMinRaw)/(100-bGrGapRight);
  iTmp:=trunc(siTmp*bGrGapRight);
  wFakeXMax:=wXMaxRaw+iTmp;

//Deal with creating blank areas above and below data cloud.
//Most of what is relevant here, and a slight change
//  was also needed in iGAtoBitmapY. The "-iGrBelowDataCloudGap"
//  term is about creating the bottom gap.

  liTmp:=liYMaxRaw-liYMinRaw;
  siTmp:=liTmp/(100-bGrGapAbove-bGrGapBelow);
  liTmp:=trunc(siTmp*bGrGapAbove);
  liTmp2:=trunc(siTmp*bGrGapBelow);

  liFakeYMax:=liYMaxRaw+liTmp;
  liFakeYMin:=liYMinRaw-liTmp2;

  wScXOffset:=wXMinRaw;
  liScYOffset:=liFakeYMax;

  siScXStretch:=wGrGAWidth/(wFakeXMax-wXMinRaw+1);//The "+1" is a KLUDGE...
  //with it, the range isn't stretched TOO far. (Without it, the last
  //data point is off the edge (or top... bottom(?) of page.)

  //showmessage(inttostr(wGrGAHeight));
  siScYStretch:=wGrGAHeight/(liFakeYMax+1-liFakeYMin);//The "+1" is a KLUDGE.
  //showmessage(inttostr(round(siScYStretch*1000)));

  siTmp:=(wGrGAHeight*bGrGapBelow)/100;
  iGrBelowDataCloudGap:=trunc(siTmp);

end;


//=====================
//Raw data to GraphArea coordinate conversion functions....

function Tld009f1.iRawToGAX(wConvert:word):integer;
//Believed completely "sound".
begin
  result:=trunc((wConvert-wScXOffset)*siScXStretch);
  end;

function Tld009f1.iRawToGAY(liConvert:longint):integer;
//This will do offset and scale but NOT the inversion which the
//  "upside down" Y axis of the bitmap demands. That's taken care
//  of withing iGAtoBitmap. The numbers from iRawToGAY run from
//  zero to wGrGAHeight (-1) (or not.. there may be a "off-by-one"
//  problem lurking here... change calc of scale factor, if so,
//  but as I plan some whitespace above and below, this "isn't"(?)
//  a major problem?
//NOTE: There are strange things going on, because of the inverted
//  scale... fiddle carefully, if you must do it at all!
begin
  result:=trunc((liConvert-liYMinRaw)*siScYStretch);//));//-liScYOffset*);
  end;

//=====================
//GraphArea to Bitmap coordinate conversion functions....

function Tld009f1.iGAtoBitmapX(iConvert:integer):integer;
begin
  result:=iConvert+wGrMarLeft+bGrAxWidY;
  end;

function Tld009f1.iGAtoBitmapY(iConvert:integer):integer;
//Remember: Bitmap "Y" coord has zero at TOP. The values
//  passed to this function will be "right", but, in bitmap
//  Y coords terms, "upside down".
//Happily, because, once in bitmap coords, we are working
//  from the top down, we don't have to worry about the
//  axis line and the bottom margin... they are "above" the
//  datapoints we want to put on bitmap.
begin
  result:=(wGrGAHeight-iConvert-1)-iGrBelowDataCloudGap;
  //The "-1" is a KLUDGE! Fixes "show the thing that should
  //  be at the bottom of the graph...
  //  But may push "thing that should be at top" over the edge,
  //    past the top of the Bitmap.
  //As I intend having some "white space" above and below
  //  the plotted data points, I can, though I shouldn't,
  //  live with this... IF it is happening. It may be
  //  that max values plot properly, i.e. in top row, too.
  //The MINUS iGrBelowDataCloudGap is to create the blank
  //  area below the data cloud. It has to be minus as the
  //  coordinates of the bitmap go up as you go down the screen.
  end;

procedure Tld009f1.ReadRecord(var w1:word;var li1:longint);
//w1, li1 can have anything in them when the SR is called. Irrelevant.
//wWhereInData must have a correct value. Should be 1 when ReadRecord
//    first called
//Pick up two numbers from global constant sDataSource.
//(Using globals, the way wWhereInData and sDataSource are being used is
//    a Bad Idea... and I will probably be punished. We shall see.)
begin
  sTmp:='';
  while (sDataSource[wWhereInData] <>'-') and
     (sTmp<>'9999') do begin
     sTmp:=sTmp+sDataSource[wWhereInData];
     inc(wWhereInData);
     end;//"While..."
     inc(wWhereInData);
  w1:=strtoint(sTmp);

  if w1<>9999 then begin //Read li1
  sTmp:='';
  while sDataSource[wWhereInData]<>'/' do begin
     sTmp:=sTmp+sDataSource[wWhereInData];
     inc(wWhereInData);
     end;//"While..."
     inc(wWhereInData);
  li1:=strtoint(sTmp);

  end;//Read li1

  if w1=9999 then begin
       wWhereInData:=wWhereInData-5;
  end;

end;//ReadRecord

end.
That's a lot done! But now we go on to the "fancy bit... in LT3Nf-2.htm....
Search across all my sites with the Google search...

|
|
![]() Page tested for compliance with INDUSTRY (not MS-only) standards, using the free, publicly accessible validator at validator.w3.org. Mostly passes. There were two "unknown attributes" in Google+ button code. Sigh.
Page tested for compliance with INDUSTRY (not MS-only) standards, using the free, publicly accessible validator at validator.w3.org. Mostly passes. There were two "unknown attributes" in Google+ button code. Sigh.
....... P a g e . . . E n d s .....