 Bookmark this on Delicious
 Recommend to StumbleUpon
You may find that the database included in OpenOffice delights you as much as it has me. This page tries to help you use it.
Remember that Open Office, including ooBase, is free. Don't let that fool you, though. Big organizations, governmental and civilian, have adopted it as their standard office suite... and saving million$, but still Getting The Job Done. And making things easy for users on different platforms... Linux, Mac, Windows all spoken here!
There's more about ooBase in the main index to this material. Adabas? Star Office? Ancient history.
This page is "browser friendly". Make your browser window as wide as you want it. The text will flow nicely for you. It is easier to read in a narrow window. With most browsers, pressing plus, minus or zero while the control key (ctrl) is held down will change the texts size. (Enlarge, reduce, restore to default, respectively.) (This is fully explained, and there are more tips, at my Power Browsing page.)
Page contents © TK Boyd, Sheepdog Software, 10/12.
Often in database work, I find that if you concentrate on what the database is designed to do, rather than what you want, you make interesting progress.
Take for example the "functions" (average, sum, count, minimum, etc) which are tantalizingly indicated if you look at the "functions" row of a query design.
In this essay, I am going to show you those functions in action. Once you have learned the capabilities provided they provide, you may start realizing things that you now want to do with a database... and even have some idea of how to do them!
To return to my thought of "concentrate on what it is designed to do..."....
For a moment, try not to think too much about what you would use the functions and grouping tools for. Just concentrate on "What can the database software do?" It is very easy to let your mind drift, and imagine that the software will do things you might want it to do, even though it doesn't do that, and thus distract yourself from what you are supposed to be learning about what it actually can do.
Continuing with that. Suppose you were learning about carpentry, and the instructor was talking about what a hammer can do. If your mind wanders, and you start thinking about screws, before long, you'll be imagining driving screws with the hammer.
As ever, a little grist for the mill will be helpful.
For this tutorial, I went off to Wikipedia and collected some data about towns in the US. I harvested records for every town in Massachusetts, Connecticut, Vermont and New York... every town in those states with a population of more than 29,999, that is.
You can download that database with town populations and a few stray other facts, zipped up with a ReadMe text file.
If you do it on 26 Oct 12, it may well be incomplete, as I am still writing this tutoria1!... but the basic table is already there.
Also in the database... very strange... is a table called "Subset". It is a clone of part of the larger table. You would not normally have such a table in a database. If you wanted the subset, you would generate it with a query... but it suited my purposes to have it available. Otherwise, the figures and tables in this essay would have become much too long. The subset lists all of the towns with populations between 29,999 and 40,000. (By the way... in some contexts, SQL (and thus Open Office's database) use "between" to mean "between and including". I don't.)
Here's a part of the table... a subset of "subset", in fact! (All towns in the four states with populations (2010 census) between 29,000 and 33,000....
State	ID	Pop	Town
ny	86	32850	Rome
ny	87	32736	Poughkeepsie
ma	66	32112	Randolph
ma	67	31915	Watertown
ma	68	31635	Franklin
ny	88	31568	North Tonawanda
ma	69	31531	Falmouth
ma	70	31394	Lexington
ny	89	31146	Jamestown
ny	90	30014	Ithaca
That's the sort of data we will work with. What can we do with it?
This tutorial isn't in the "Level 3" group for nothing! I've had a frustrating several hours just roughing it out for you. There are things that don't quite make sense to me.
It must also be said that what follows has more rough edges and loose ends than I like to leave in one of my "published" tutorials. I hope that you will...
1) read it with some patience... no one's forcing you, after all,
2) not judge all of my work by the standards you find here,
3) But, none-the-less benefit from it! If only for ideas sparked!
It certainly won't give you "all the answers", nor even, I suspect, 100% right "answers"!
Food for thought, and temptations to try things, at least, though, I hope!
"Grouping" is a LITTLE like sorting. If I were to group the above by state, I would get the following, where the "===" lines have been put in by me by hand to draw your attention to the groups the data has been gathered into. (Neither VT nor CT have towns in this size band.)
State	ID	Pop	Town
==== Group of MA towns ============
ma	66	32112	Randolph
ma	67	31915	Watertown
ma	68	31635	Franklin
ma	69	31531	Falmouth
ma	70	31394	Lexington
==== Group of NY towns ============
ny	86	32850	Rome
ny	87	32736	Poughkeepsie
ny	88	31568	North Tonawanda
ny	89	31146	Jamestown
ny	90	30014	Ithaca
The database software also lets us create groups within groups. Let's do that with the same towns, breaking up each group into categories based on thousands of residents...
State	ID	Pop	Town
==== Group of MA towns ============
   --- Sub-group: 32xxx
	ma	66	32112	Randolph
   --- Sub-group: 31xxx
	ma	67	31915	Watertown
	ma	68	31635	Franklin
	ma	69	31531	Falmouth
	ma	70	31394	Lexington
==== Group of NY towns ============
   --- Sub-group: 32xxx
	ny	86	32850	Rome
	ny	87	32736	Poughkeepsie
   --- Sub-group: 31xxx
	ny	88	31568	North Tonawanda
	ny	89	31146	Jamestown
	ny	90	30014	Ithaca
How we do that, we'll come to in a moment. But first, we can now look ahead to what the functions are for. In the tables above, now that the records have been grouped, you can make the following sorts of observation. (Some of the examples are strained... I'll address that in a moment.)
There are four cities in MA with between 30,999 and 32,000 residents.

The average population of 32xxx cities in NW is 32,793

The biggest town in MA with less than 32,000 people has 31,915
You've just seen examples of the functions "count", "average" and "maximum". (There are more to play with, of course.)
As I said, some of those examples are strained. However, if you were applying the same tools to different data, things like "the maximum field value found in this group" would be interesting.
And, to finish off this section, one little bit of good news. You deserve a reward by now, don't you think? The good news is that you don't always have to group records in order to use a function. You could, for instance, have the simple total population of all the towns. (I'll show you how to get this. The query is called "queryTotalOfAll". (It has been written to total the town populations in the "Subset" table.) I've also included a report in the database which reports the same information, with a little "stuff" added, and the presentation tweaked. The report is called "repTotalOfAll"
For this essay, we are only going to look at grouping in queries. I believe grouping is possible in other contexts, in particular in reports... or am I just remembering that a report can be based on a query which is doing some grouping? Certainly that sort of report is possible... I'll show you two!
We will now make a query which will look at the records in the table "Subset". You'd use the same techniques if looking at the larger table.
You can use either the new query wizard, or the "Create Query In Design View" option. In any case, you will eventually be working in the Design View, as that is how you edit a query, to get it be "just right". For creating a table, I think the wizard is more trouble than it is worth. But the wizards can, sometimes, be helpful "hand holding" for the beginner.
We'll create a query which will group the records by what's in the "State" field. It will also add up the populations of the towns, group by group. We'll start the query with the wizard.
Just before we set into that...
It would be nice, maybe, to be able to create the following result...
State	ID	Pop	Town
ct	15	39559	Shelton
ct	16	36383	Torrington
        Total for CT:		75942	========

ma	54	39880	Holyoke
ma	55	39502	Beverly
ma	56	38499	Marlborough
ma	57	38120	Woburn
ma	58	37819	Amherst
ma	59	35744	Braintree
ma	60	35608	Shrewsbury
ma	61	35177	Chelsea
ma	62	34032	Dartmouth
ma	63	33802	Chelmsford
ma	64	33201	Andover
ma	65	33006	Natick
ma	66	32112	Randolph
ma	67	31915	Watertown
ma	68	31635	Franklin
ma	69	31531	Falmouth
ma	70	31394	Lexington
      Total for MA:		592977	========

ny	85	35462	Long Beach
ny	86	32850	Rome
ny	87	32736	Poughkeepsie
ny	88	31568	North Tonawanda
ny	89	31146	Jamestown
ny	90	30014	Ithaca
       Total for NY:		193776	========
Open Office can give you such a report... but not with a simple query! A query returns a table. In a table, all rows and columns are "equal".... you can't have "special" rows like the ones with the totals for each state. (Well, you can have one "special row" at the top, if you want to consider the row with the labels for the columns as part of the table- resulting- from- the- query. But it isn't really part of the table. It is merely labels for the table's columns.
Part way though the query wizard (step 4), we are going to be asked what sort of query we want to make. We are going to make a "Summary Query". The result will be....
State	Pop

ct	75942
ma	592977
ny	193776
(The result will be, as it must for any query, a simple table... One row per result of adding the populations of the towns in a group. First column: State's name; second column: total population of the towns.)
Because we want to "do things" with our groups of records, we have to give up, here, seeing the individual records used to determine each result. In this case, to determine each sub-total.
While we will often, for other purposes, want to see the individual records, we can't, if we want to use the functions.
We can show the individual records, if we don't use the functions. For that we make a "Detailed query"... but it doesn't allow grouping. (Although you can use sorting, to get almost the same result.)
So... to create the summary of population totals, state by state...
Invoke "Use Wizard to Create Query"
Step 1: Tell the wizard that you want to use table "Subset". Put fields "Pop" and "State" in the "Fields in Query" list. Those are the only ones we're using. Leave "ID" and "Town" out, or you will have problems. You can try to set the order of the columns in the resulting table by the following... but it may not work. If it doesn't, you can fix things in the query design window by rearranging the columns. Either select "State" first, and then "Pop", or use the "up" and "down" buttons to put the fields in that order in the "Fields in Query" list after both are there.
Step 2: We don't NEED to impose any sorting, but you may want to sort the results by "State". There's no point in sorting by "Pop", because we will not be seeing individual records.
Step 3: Search conditions: None. That isn't to say you would never have any, if setting up a "Summary" query. We're just skipping that extra complication today.
Step 4: Type of query? We're making a "Summary" query. Because we're making a summary query, we have to tell the wizard which field to use to group the records. Choose "State". At the same time, although I was trying to separate out the "grouping" and the "using functions", specify that you want to use the "get the sum of" function. (It does make sense that the wizard would ask for that here. There's no need to use grouping in a query if you aren't going to apply a function. As I said... when making a "Detailed" query, you can "group" records, but you merely sort them. Our brains will perceive "groups", but the software will only see order.)
Step 5, "Group"??? At this point, step 5 is greed out. When, from step 4's page, you click "next", you will go directly to step 7. Our query does involve grouping... but the sort of grouping that is involved has already been implicitly communicated to the software by the choices we've made. Specifically, we have "chosen" to group the records by state. We will get one line in the results table for all of the records involving CT, one line for all records involving MA, etc.)
Step 7: Aliases: This step allows us to determine the column headings. Each column is associated with a field, and there's a proposed heading, alias, for that field already filled in. You can change the headings. In this instance, it makes sense to change the heading for the column associated with Subset.Pop to "Total population of mid-sized towns in state". (If you agree that "mid-size" is a reasonable description for "towns of between 29,999 and 40,000 souls."
Step 8: Overview: After you give the query a good name, I used "queryPopSummary" just click "Finish"... but don't be alarmed! Our result is imperfect. Close it. Right-click on the query just created. Click on "Edit", and you will have the query up for editing.
In the "state" column, in the lower part of the design window, the box for "Visible" is not ticked. Add a tick. Run the query again, within the design tool, using the icon in the toolbar. (Or the menu: Edit/Run query. (Or F5!)). You'll see the revised result at the top of the design tool window.
If the columns in the result from the query were not in the order you wanted, you can rearrange them just by dragging the plain gry rectangle just above the "Field" row of any column in the editor display.
In the database you can download, you'll find a report called reportTotalOfAll. It is very little more than the results of the query we just created... but the result is presented in a "wrapper" with some text explaining what is in the table at the heart of the report. While I am a great fan of the Report Builder add-on, for something simple like repTotalOfAll, you don't need it.
Here's how I created repTotalOfAll...
Invoke the report wizard.
Step 1: Select the query we just made, queryPopSummary, and tell the wizard to use all of the fields of the query in the report.
Step 2: The default labels will be fine. We can alter them later, anyway.
Step 3: Grouping: Tell the wizard to group by the data in the "State" field.
Step 4: It would probably be as well to sort the results by "State".
Step 5: Layout. I just used the default.
Step 6: Be sure the name the report will have is satisfactory. I changed the default, made it "reportTotalsByState". The pros and cons of "static" vs "dynamic" reports are discussed in a different tutorial on my site. For now, elect "dynamic".
Note... when you go into "edit report", you may think that you're dealing with a "mere" OpenOffice wordprocessor document. You can add bits, as I have, "around" the table.... and this can be important. Making changes to how the data in the table is presented is not for the faint hearted! To rearrange the order of columns, you can.... insert an (empty) column. Select a whole existing column, copy it, and paste it to the empty column you created, and then delete the badly placed original. More than that is a story for another day! (I have written tutorials about report generation for you. This report was just to whet your appetite, and make it clear that the query need not be the ultimate product.)
That presentation gets, perhaps, a bit "over the top" for a simple little table of the populations of the mid-sized towns in each state. Though I haven't time to go into details here, in the .zip file you will find a form called formPopByState which embeds the results of the query, presenting them in yet another manner.
I don't know about you... but I am exhausted.... and out of time.
I'm afraid that the details of producing...
State	ID	Pop	Town
==== Group of MA towns ============
   --- Sub-group: 32xxx
	ma	66	32112	Randolph
   --- Sub-group: 31xxx
	ma	67	31915	Watertown
	ma	68	31635	Franklin
	ma	69	31531	Falmouth
	ma	70	31394	Lexington
==== Group of NY towns ============
   --- Sub-group: 32xxx
	ny	86	32850	Rome
	ny	87	32736	Poughkeepsie
   --- Sub-group: 31xxx
	ny	88	31568	North Tonawanda
	ny	89	31146	Jamestown
	ny	90	30014	Ithaca
... will have to wait until another time. What we will need to do is to create an intermediary table....
State	ID	Pop	Band Town
ny	86	32850	32	Rome
ny	87	32736	32	Poughkeepsie
ma	66	32112	32	Randolph
ma	67	31915	31	Watertown
ma	68	31635	31	Franklin
ny	88	31568	31	North Tonawanda
ma	69	31531	31	Falmouth
ma	70	31394	31	Lexington
ny	89	31146	31	Jamestown
ny	90	30014	30	Ithaca....   etc
... and then "work our grouping magic" on that. Should be simple... right? Sigh.
Again... no time to deal with this properly, but to whet your appetite, "inspire you"....
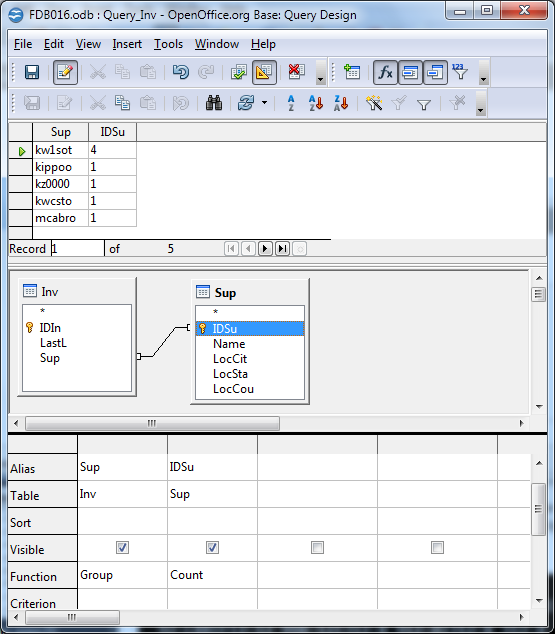
The following shows the design of a query which can produce the results showing at the top. It is from a stock control database. The "Inv" table lists one invoice per record. The "Sup" table lists one supplier per record. The query tabulates how many invoices are present from each supplier. I.e., according to what we see at the top of the query design window, there were 4 invoices in the database from supplier "kw1sot", and one invoice from each of the other four suppliers.
So! Sorry to leave you with loose ends, but I hope the journey was still worth it? I should thank....
http://searchenterpriselinux.techtarget.com/tip/Turning-data-into-information-with-functions-in-OpenOfficeorg-Base
... for helping and inspiring me. There is more Good Stuff there!
I dislike 'fancy' websites more concerned with a flashy appearance than for good content. For a pretty picture, I can go to an art gallery. Not everyone has fast broadband.
I present this material in a format aimed at to helping you USE it. There are two aspects to that: The way it is split up, and the way it is posted. Details at my page about how the material is split up and how it is posted.
Please remember the material is copyright. (TK Boyd, 2006 and later) The procedures in the page just cited are suggested only for convenient personal use of the material, however, also....
Feel free to use this information in computer courses, etc, but a credit of the source, quoting the URL, would be appreciated. If you simply copy the pages to other web pages you will do your readers a disservice: Your copies won't stay current. Far better to link to the original pages, and then your readers will see up-to-date versions. For those who care- thank you. I have posted a page with more information on what copyright waivers I extend, and suggestions for those who wish to put this material on CDs, etc. (There is at least one prison using the material for inmate education. Situations do exist where good internet connections are not possible!)
Translations are welcomed. Tell me about yours, so I can post links to it. (More information at the page about copyright waivers.)
PLEASE >>> Click here to visit editor's Sheepdog Software (tm) freeware, shareware pages <<< PLEASE
If you liked this ooBase tutorial, see the main index for information other help from the same author.
Editor's email address. Suggestions welcomed! - - - Want a site hosted, or email? I like 1&1's services.
![]() Page tested for compliance with INDUSTRY (not MS-only) standards, using the free, publicly accessible validator at validator.w3.org. Mostly passes. There were two "unknown attributes" in Google+ button code. Sigh.
Page tested for compliance with INDUSTRY (not MS-only) standards, using the free, publicly accessible validator at validator.w3.org. Mostly passes. There were two "unknown attributes" in Google+ button code. Sigh.
. . . . . P a g e . . . E n d s . . . . .